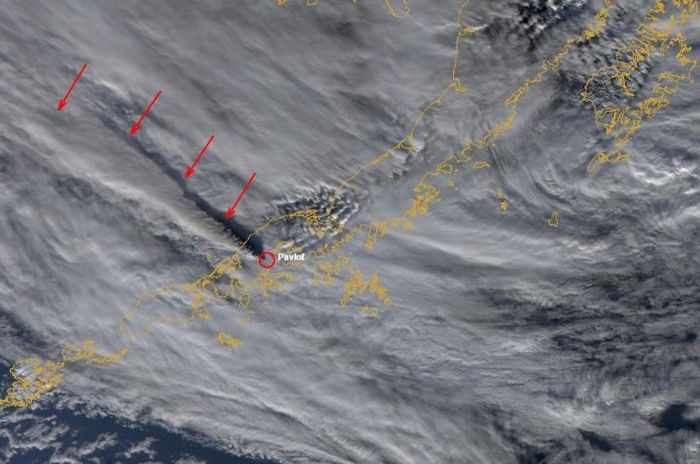
Pavlof Ash Cloud Nov 15, 2014. Photo courtesy AVO.
The Pavlof eruption that began Nov. 12 intensified Saturday to Aviation Code Red for ash emissions observed to over 9,100 m and Volcano Alert Level to Warning. AVO Pavlof page with links to webicorders can be found at the following link. http://www.avo.alaska.edu/activity/Pavlof.php

Pavlof Webicorder PV6 EHZ AV Current as of 1040 AST, Nov 16, 2014
Mount Pavlof is part of a multiple volcanoes which comprise the Emmons Lake Volcanic Complex that sits some 950 km southwest from Anchorage. Emmons Lake has multiple stratovolcano cones, embedded calderas, the largest of which measures some 11 x 18 km in diameter. The last caldera forming eruption from the complex is thought to be some 10,000 years ago. http://pubs.usgs.gov/sir/2006/5248/
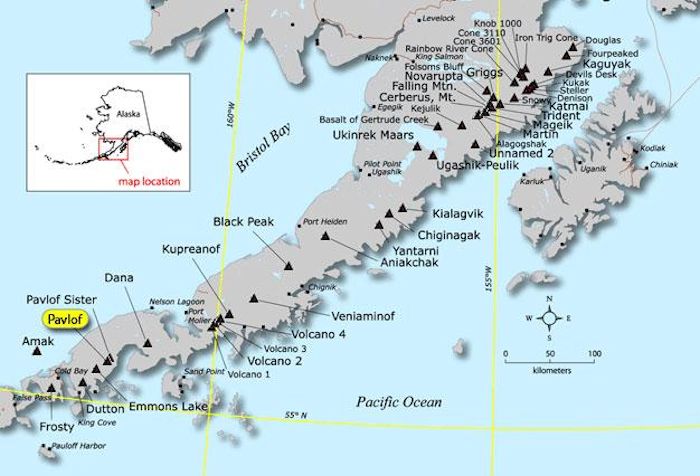
Map of Location of Pavlof Volcano
Pavlof itself measures some 2,500 m tall and is next to a smaller cone called Pavlof Sister and a cone that shares its edifice called Little Pavlof. It is the most active eruptive center of the complex, with multiple eruptions observed since the early 18th Century. http://www.avo.alaska.edu/images/image.php?id=22963
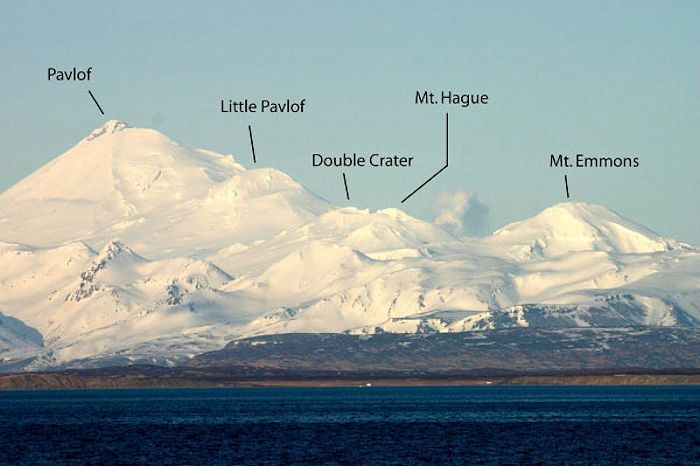
Pavlof Volcano and Neighboring Lake Emmons Volcanic Complex Group
These eruptions range from Strombolian in nature with lava flows down the flanks to more powerful eruptions putting ash on surrounding communities of Sand Point and Cold Bay. Both communities are currently under a watch for ashfall. Sand Point is some 90 km east of Pavlof. Historically observed eruptions have measured in the VEI 2 – 3 range. Pavlof is one of the most active volcanoes in the Aleutians. http://www.avo.alaska.edu/activity/ash3d/cloud_height.php?vid=ak210

Initial Eruption as of Nov 12,2014
The Alaska Volcano Observatory’s primary mission is aviation safety on the Great Circle airway overflying the Aleutian Islands. http://www.adn.com/article/20141115/cold-bay-sand-point-residents-could-see-ashfall-pavlof

Initial Day of Eruption Nov 12, 2014
I will do an extended post on the Emmons Lake Volcanic Complex in the days and weeks to come. Cheers –

Last Pavlof Eruption Jun 4, 2014
Update: as of this writing, (1045 L AST), it appears that the large eruption of Saturday has subsided for the time being. Cheers –
Update 2: Link to the CIMSS Satellite Blog courtesy of Sherine France. It shows the progression of Saturday’s plume in multiple wavelengths / satellite photos. Many thanks, Sherine.
http://cimss.ssec.wisc.edu/goes/blog/archives/17179


What the…?
Have you seen the blue seismo-line on vala.png? DJK – Dingjujökull
What is that? Harmonic tremor? Becoming wider while quakes happen. After that becoming smaller again.
Even at storm conditions times ago, this did not show up like it does now.
I didn’t recognize that two hours ago.
What do you think?
I only just ‘noticed’ it too … I thought it was a new one 🙂
I’ve just checked back on previous screen shots … from what I can see, its not new but has been off line for a while!
Looking at other data it just might be wongly set and magnifying the tremor … not an expert, simply my observations 🙂
ok, having been offline for a while makes sense.
Nevertheless, something is making a sound of a bumblebee down there! 🙂
I don’t seeanything special today there. Perhaps a minor harmonic tremor pulse, but something very small. Probably nothing.
The drumbeats show shorter intervals. The whole blue line is much more prominent than at afternoon.
Lets me think of El Hierro graphs in a way.
Maybe I see ghosts. Will not exclude that. 😉
Depending on where it is, it may be registering the eruption at Holuhraun.
The Daily Mail has reported that ash from the erupting volcano in Alaska has been found in Northern Ireland raising concern that this could cause air travel chaos. I know you can’t believe everything that’s reported in the Daily Mail.
http://www.dailymail.co.uk/sciencetech/article-2841296/Volcanic-ASH-CLOUD-travel-entire-Atlantic-Ocean-study-claims.html
There are a number of stories today about this but it’s 1200 year old ash! Not sure how they can be sure if it did cross the Atlantic – maybe it came over the top?
The Daily Wail is always good for a laugh on science stories; in this case that Bona-Churchill “is scheduled to erupt every hundred years” I wasn’t aware that volcanoes had published timetables; and since Mt Churchill hasn’t apparently so much as twitched since the VEI6 in the 9th century, that 100 year figure is a bit off. Guess now they’ll be yelling that it’s “overdue”
They should turn their entertainment/gossip reporters loose on Mt Churchill, then we’d get some really dramatic non-news stories!
They had beter wrap up warm in that case: it’s bloody cold there!
Do them the world of good! 🙂
Agreed Mopshell, freezing their brains (if they have them!) and then thawing may have some effect in kick starting a bit of electrical activity. It most certainly can’t make them worse! I know my grammar skills are poor but theirs are atrocious and don’t even get me started about their spelling!
That ash could never come at a significant level to UK. That’s typical Daily Mail.
Even Toba, would be able to go that far…
but minor tiny amounts of ash, yes, they can travel around the world. Example, Puyehue-Cordón Caulle in 2011.
http://www.ruv.is/frett/holuhraun-eruption-fresh-video
Latest video – from 17 Nov 2014.
Also there are lovely thermal images of the eruption on the IMO news update page. Could some kind person cut and paste if appropriate. 🙂
Hello, Talla!

Thanks for the heads up!
I guess the link for the video has already been posted and I will try to paste here the link for the IMO thermal images (thank you IMO!)
Thanks Renato! 🙂
these were up for tests some days (weeks) ago in reykjavik.
Seems all froze in IMO today
http://www.vedur.is/skjalftar-og-eldgos/jardskjalftar
and all came back (likely just at glitch)
BTW, one in Hekla last night at 7,5 km depth
Thanks Islander, I saw that this morning. Deep enough to not be surface ‘noise’, to be honest I don’t want Hekla to do anything silly until Bardar has finished doing whatever it is he is doing! 😀
As crazy as it seems, I would like to see a small eruption of Hekla now. I haven’t seen Holuhraun for a long time, and its rather “impossible” to go now there (except by expensive airplane or heli), so Hekla would give a nice prize. I plan to fly again over Holuhraun in December…
The first image above (courtesy of IMO) goes along with the second one, followed by the following cation: “Thermal images (FLIR) of the craters, seen from the west (hence N to the left and S to the right).
The upper image is taken recently, 18 November 2014 at 16:00. Now, thermal convection is greatest from the northern part, Heimasæta, and the temperature is somewhere in the range 1147-1188°C.
The lower image was taken 23 October 2014. Then, craters Baugur and Heimasæta were both active. Institute of Earth Sciences, information from the field group.”
About the steaming (question from previous page) – it’s happening where the lava over-ran the course of the river – you can see where on this IMO map: (I’ts big so take out the xxx from the front of the link)
xxxhttp://en.vedur.is/media/jar/myndsafn/full/Yfirlitskort_20141114.jpg
A Phys.org article about a massive landslide recently identified in Utah. Age is some 22 MY old. Total volume is some 1,700 – 2,000 km3. Slide length is some 90 km. All this makes this slide a landside version of irregular collapses of portions of Hawaiian volcanoes. Material that slid was mainly andesitic mudflows, breccias, lava and ash flows. There is another similar slide identified. Interesting what you can see when you look at whatever you have always seen with new eyes. Cheers –
http://phys.org/news/2014-11-ancient-volcanic-field-utah-massive.html
http://avcams.faa.gov/sitelist.php#currentImages
pavlof I think you can see the ash coming up …
Cold Bay NorthEast
I know it’s OT but there was a lot of interest recently in Mannen, the Swedish mountain which was expected to slide. I watched it for a couple of days but nothing happened. (I feel I knew every rock on that scree apron!). I’ve lost the link now. Did anything happen? Is it still “imminent”? Is it still slipping?
It’s in Norway – not Sweden! 🙂
Still slipping, but now very slowly… Everyone is puzzled… I think people still are evacuated from the immediate area, but cargo trains may now pass beneath it (they were put on hold earlier…)
I cannot believe I did that – Profuse apologies to all in Norway and Sweden. Typical Brit mistake, sorry.
Link to webcam. http://www.vgtv.no/#!/video/102498/direkte-fjellet-kan-rase-naar-som-helst
I gather that once the really cold weather sets in there is far less risk of it slipping so it may easily last out until the Spring thaws now.
Off topic, and quite edging on the conspiracy theory realms (sorry for posting it, but I wouldn’t post it, if it wouldn’t be in the mainstream news, and be something of a bit of value and truth.
http://www.ruv.is/frett/myndband-af-eldhnetti-vekur-furdu
There are rumours that yesterday a bright explosion detected over Russia might have caused by a nuke, according to Russia tv. This morning also in other news, I saw the same similar report from Donestsk, a bright glare in the sky and entire city goes dark. Yeah, maybe it wasn’t a EMP or a nuke. Let’s just assume that, for sake of sanity and as a simple explaination.
It still feels a global military situation rather uneasy, especially as NK threatens also today to test another nuke again (and NK is a sort of proxy from China to a degree). Not a conspiracy theory, I repeat, but war tensions are increasing to a unconfortable level. Just two weeks ago, Russia was entering the territory of many countries in Europe with warplanes or submarines, a while ago the US was doing it in the Black Sea.
It is not just at VC that people are moody and more agressive than usual, it’s also at a global level, but that risks serious consequences. We all know are war-prone our history tends to be, and humans are stupid (or sometimes incredible stupid). I fear we might see something happened in soon, if people don’t cool down their exalted moods. Like in the thirties, people will feel sorry that it will get too late before they all allow that to happen. Remember be it in Russia, the US or Europe, it’s all a “democracy” (at least you vote for it), and the masses voted, didn’t protested, allowed for this to have reached this point. Just like all the S*it of the 1930s.
Maybe the nuke stories of Ukraine and Russia are fake, maybe it is just propaganda, but even if it is propaganda it’s a dangerous one. These tensions with Russia are going a bit over the limit. I don’t blame neither NATO neither Russia (both are to blame), people just have to cool down and breath. Definitively we are in cold war II. The “poking your enemy” sort of thing, the propaganda, the small acts, are all there.
Any form of nuke would be detected immediately by all the big players on the world scene… And then shortly after that by research facilities that all over the globe that measures composition of nuclear materials in the atmosphere….
Of course it would. Unless it would be some new sort of weaponry. But in this case, I still think this is just war paranoia and propaganda. But too much in mainstream news for my taste, too much tension…
It couldve been a meteor exploding, just like what happened in 2013.
Probably not a meteor. It looks impressive on the videos but it seems to have been a local event, within a few kilometers of the people who filmed it. An explosion of some sort but not massive.
Report I read suggested there was an old chemical plant roughly in the direction of the -presumed- explosion. I think anything nuclear would be instantly detected- an airburst from dispersed short-life isotopes.
It’s not long since the peak of the Leonid meteor shower so there’s plenty about.
I share your concerns Irpsit. Can only hope cool heads prevail and we learn the lessons of history
The main stream media has the following functions:
(a) provide a level of noise that reliably suppresses any new ideas if they are not magnified with an apparatus
not at the disposal of anyone but the vested powers,
(b) capture your attention with irrelevancies to make sure you never think even once in your whole life,
(c) provide propaganda as needed,
(d) get control of any public discussion as early as possible by putting the desired spin on it (suppress this, magnify that),
(f) prepare the ground for future propaganda by feeding false stories at a low level to be dug up when needed
and provide preceedent sources for later magnification.
So an excuse to cite non-mainstream media constitutes a basic misunderstanding of what is going on in western civilization.
I meant: an appology when citing…
It is almost certainly not a nuclear device of any sort. The visual signature, while striking, lacks the double-flash characteristic of nuclear devices, and there have been no known reports of electronics shorting out from an EMP pulse.
To have a fireball in the position seen in the videos would require a medium to high altitude airburst, and we would have had reports of fallout by now, as well as most videos of the even being nonexistent due to being erased by the pulse.
It also doesn’t match the signature of an incoming meteor, which does raise interesting questions of WTF, since we have no known explaination for them. No, it isn’t an industrial accident either, since an accident of that magnitude would have already been identified.
Yes, it has massively raised tensions, but unless someone has figured out a terrifying new WMD, it is a new and unexplained natural phenominon that is going to take a while to identify.
One of the videos I saw clearly shows a ground source, and it strongly reminds me of the 2012 St Petersburg power station explosion that blew in a similar size brightness. I’m wondering if it may have been a large elctrical blow out on a station.
That’s my belief too. That the city then went dark supports our theory.
Been away so someone might have mentioned this elsewhere in the thread. Any idea what the sudden rise and even more precipitous fall (as in the 23:15 UTC image) in the Barda GPS is due to ? Are they hauling it out of the snow again ?
Maybe all world leaders should be mothers, they seems to have a calmer view than us blokes. As Arnie said in terminator, it’s in our nature to destroy ourselves. Ukraine – yes this could become a cuba, hopefully not worse.
How the **** did my comment get down here. Dragon please delete!
Just a very long reply thread SJ. I wondered where mine had disappeared to at first also.
“It is not just at VC that people are moody and more agressive than usual,”
I always find it so sad that people forget a simple and sincere apology for upsetting another person or even country can have such a profound effect in defusing tensions. Even if one feels in the right over something one can apologise that their words hurt another person.
Prety big quake at around 20:30. Not showing up on the druplots yet.
Incomming quake squall with lots of tremor types …….DJK blue wierd amplified plot …… looks just like fluid gas movement…….but in the bigger quakes its is recording some what correctly

& the next half hour

The blue line – DJK – that’s the SIL station directly above the line of the *dyke* I reckon. Been noticing more deepish quakes on the maps there in the last few days.
Courtesy of IMO
Yes I, too, think the dyke is back…
Maybe the dyke is getting wider, more rifting perhaps?
Gizmo, sorry I forgot your reference to the blue line at the top of this page.
🙂 Don’t mind, Mr. Echo!
The blue line was behaving normally 9 hours ago, I was told.
So it’s good that you and DT mention it now.
Also, Leslie Robson Gompf referred to these earthquakes on the line of the dyke near the edge of the glacier, at 03.55 on the 19th (previous page).
I don’t want to steal anyone’s thunder. Just trying to bring things together 🙂
You’re not stealing anyone’s thunder. We all appreciate support for our ideas and it really helps when someone works at bringing observations together as you are doing – I try to do the same. Besides, we are here to mull over all ideas to our heart’s content – that’s the joy of VolcanoCafé! 🙂
Thanks for the recognition, EchoohcE. I have to admit that when I saw the start of your post, I thought “Isn’t that what I was talking about?” Next I thought “maybe it was absorbed subliminally.” So I managed to take credit already 🙂 While I’d love to get a theory or prediction that is close to correct, I like to think that my observations might help to refine someone else’s theories. After all, I don’t know that I would have any theories myself if it weren’t for the observations of others on here!
looking at the larger quake onsets around M1.5 …..when the p wave arrives …blue is really close to BB …..perhaps its got a stepped filter………high gain to pick up small tremors at BB….and swiches over to low gain when a large quake strikes so not to “blow the unit up” / oversaturate …IMO might have just installed this unit to moniter BB vary closely …………which would be wise 😉
This station went off line back when I posted the picture of the strange truck on the webcam from the station
It is just north of Grimsfall
The intensity of the signal is a result of wind and scale
If you compare it here it is lower than VON
IMO replaced a non functioning stream at 13:06 today:
20141120 13:04 DJK00-6188Z2 Blue (Hasn’t been working for at least two weeks)
20141120 13:08 DJK00-6188Z2 Replaced with DJK00-3356Z2
The new one is quite loud. Why.. conjecture.. it hasn’t been normalised yet?
Yep, the station started working again back on the 14th and you can also see here the tremor is not any higher than the other stations
That makes sense DT.
Thanks for the reply further down the page, Fred! @22.14 (“IMO replaced a non functioning stream at 13:06 today:
20141120 13:04 DJK00-6188Z2 Blue (Hasn’t been working for at least two weeks)
20141120 13:08 DJK00-6188Z2 Replaced with DJK00-3356Z2
The new one is quite loud. Why.. conjecture.. it hasn’t been normalised yet?)
oops again
Thanks Fred
Hi DT … thanks to your posts yesterday I am beginning to recognise and categorise these quakes as they occur!
Looking at the recent and not-so-recent Bardarbunga eartquakes: the plot below
shows all the M3+ quakes in the northern half since mid September, plotted as
depth versus latitude and longitude (in kilometers from the centre point as
used by IMO). It has the same information as the 3d plots shown by others. The
interesting bits are the empty regions, avoided by quakes. There is a clear
lack of quakes at depth of ~6km, and in the plot versus longitude, a division
between the NE and NNE quakes (left and right of 5km longitude). Over the past
week, the NNE corner has become more active and the NE side less so.
Looking at the more recent quakes, the plot below shows the depth-longitde
relation for the past 10 days only. There is a beautiful cluster at 6km
longitude, 8-9km depth. This first started at the left end of the
sequence. There is a curved shape to it. It looks to me like slip along a
steeply inclined fault plane intersecting the caldera wall (if that deep down
it can still be called the wall) which has become active.
The large number of smaller quakes but lack of larger ones, recently, may be
related to less subsidence but over a larger area. It could also reflect
some heating of the rock.
Thank you Albert … great plots and explanation.
Say what you want, but these quakes or at least some of it, do not look pure T to me. At least MT or some perhaps M.
Er… what is MT and M? Are they representative of magmatic tectonic and magmatic? Not that I can’t tell the difference between the two anyway! I’m still struggling with the distinction between P waves and S waves. I have yet to find a really decent diagram that points out where P waves start and end and S waves start and end. You’d think that would be easy to find but oh no, hours of googling later, I still haven’t found a single decent diagram.
I’m guessing T = Techtonic and M = Magmatic? They all looked mainly magmatic to me.
Would tectonic be snappy and magmatic squishy? Sort-of like bonfire toffee v fudge?
Mopshell, Deep Thought posted a decent diagram of earthquake types at 23.03 on the 18th November, on the previous page…could be what your’e looking for 😉
Yes, I did see it – even downloaded a copy of it -but it doesn’t help me much. I think I just need to develop better observational skills.
It doesn’t help at all with distinguishing between P waves, S waves and L waves. Still looking for a that elusive diagram! 😀
IMO replaced a non functioning stream at 13:06 today:
20141120 13:04 DJK00-6188Z2 Blue (Hasn’t been working for at least two weeks)
20141120 13:08 DJK00-6188Z2 Replaced with DJK00-3356Z2
The new one is quite loud. Why.. conjecture.. it hasn’t been normalised yet?
In response to EchoohcE November 20, 2014 at 21:53
Dragons. Please feel free to delete.. Posted in wrong place.
(previously posted in the wrong place)
Been away so someone might have mentioned this elsewhere in the thread. Any idea what the sudden rise and even more precipitous fall (as in the 23:15 UTC image) in the Barda GPS is due to ? Are they hauling it out of the snow again ?
It’s lighting the clouds beautifully on Mila1, btw.
It’s looking great on Mila 1 and Mila 2 – I’ve been happily using up my internet speed allowance watching both of them. 🙂
I shouldn’t think they’d be doing that at this time of night but you never know with those adventurous spirits at IMO and IES! Give it a couple of hours and see if it settles down. It may just have been shaken about by a shallow quake rumbling underneath it.
Perhaps my tired old imagination, but am I seeing a slight change in the way things are going? Multiple column quakes in BB, what looks like very low level continuous tremor, the caldera flattening out and quakes under Holuhraun… Just a gut feeling (it was the Surströmming) but it does seem to be a general change.
Well unless my brain is addled (always a possibility) Barda GPS WAS showing a rise of about 20cm in the last 4 hours – now (23.40) it’s heading down sharply again. Last time such sharp changes happened, the techies were doing something to it
I am pretty sure this is a glitch in the plotting software as a true 180 min line would average 90 mins BEHIND ‘now’ because you can’t see into the future. I suspect that the leading edge algorithm is that the last few points are actually not 180min averages (they can’t be) but some sort of automatically adjusted variable X-minute average, that is continually readjusted until that point is 90mins benind ‘now’.
It would be really nice to have the raw data to take a look, and see what new curve fitting would show up. Sadly that data is not available.
Looking at the data now (for 11-12 pm), what was a pronounced rise followed by an even sharper fall has changed to a gentler though perceptible fall. You can still see the sharp rise and fall on the red 30 minute trace or the “immediate data” trace. Looks as if you should always ignore the last 180 minutes of the 180-minute line!
Clive, yes, I agree that you might be seeing a slight change. Then again, I think that as soon as people start saying that Bard has settled into a pattern and maybe we don’t need to check in every few hours throughout the day, he/she changes it. But then that would be a pattern, wouldn’t it? 😦
Okay, this is more weird that dogs tending to align with geomagnetic fields when they poop.
Spooky Alignment of Quasars Across Billions of Light-years
VLT reveals alignments between supermassive black hole axes and large-scale structure
http://www.eso.org/public/news/eso1438/
Now the big festering question is “Why?”
My guess is that it has something to do with the concentration of matter coalescing to the filament tends to impart angular momentum around the axis of the filament. Structures forming from that matter would inherit that angular momentum and tend to be aligned along the axis of it… but I’m just some idiot in NW Florida.
Or
They are nicely arranged stepping stones between the Multiverses 😀
Whilst we’re in an extraterrestrial mood – check this out – Mopshell, is this anything to do with you? Looks suspiciously like your avatar… 🙂
From Spaceweather(dot) com
Bigfoot the sunspot.
I see the space teddybears are back in the galaxy – must time for their regular millennial picnic! 😀
Wow I thought she had been ill, but she really went to the sun? Impressive! 😀
A dirty paw print in the axminster 😉
http://hyperphysics.phy-astr.gsu.edu/hbase/astro/astfus.html
Fozzie Bear
Yep, I’m going with this theory – I like this theory! I can combine this theory with the idea of wormholes too which is really appealing! 😀
Or it could be that we’re living in a simulation of a universe. After all, there should be more simulated universes than real universes, provided a meaningful number of universes can support intelligence.
I live the idea of multiple universes because I can daydream that in one of them at least, I’m slender and beautiful and outrageously successful! 😀
Ah but Mopshell, you might be all of those things in an alternate universe but I would choose the one where I am happy with what I am. In this universe I am pretty close to that despite being dumpy and unbeautiful so I am planning to stay put. 😉
That’s the very best way to look at it, Frances! 🙂
Well, since you are gonna “go there,” if you follow that tack, the conditions to support life as we know it are exceedingly rare in the grand scheme of things. There are physical constants that should they have been one or two digits off from what we know them as, life (and matter) could not exist in any fashion near to what we see it as. So, that would mean that the conditions of our universe are quite a rare set of “coincidences” that make us possible, given the untold other possibilities in the “multiverse” idea. That in effect, makes this universe “The Black Swan.” Something so rare that it could be considered impossible. If that’s the case, we owe our existence to the law of large numbers. God ran so many test samples that eventually, the ultra-rare had to happen.
I’m not sure that’s so unexpected, these galaxies are ‘quite close’ to each other, and would have been very much closer 10B years ago. In many ways it would be odd if there was not some sort of correlation as, in a sense, at one time they would have been close. What is DOES do is restrict, perhaps severely, the range of possible hypotheses that produce this result.
Posting yesterday’s earthquake summary early because I don’t expect any more additions to it. However, should there be additions, I’ll re-post an updated version at around 10am.
Team Red is striking early today. It may not be huge but I’m guessing it’s the first M3+ for the day.
Looks like a pretty good breeze tonite.
Mopsey, Is this any help?
A very pretty picture! I love all those Ps breaking from the crest of the wave. 🙂 Unfortunately, just knowing what P waves, S waves and L waves are does not help me to differentiate them in an earthquake signature on a drumplot. 😦
Hi Mops! Being pretty ignorant on these things I thought that the Iceland drumplots we look at are so close to the quake epicentres that they barely have time to set up P and S waves, they would only pick these up from quakes that are very far away (eg Hekla picks up both P and S waves from mega quakes across the world), but I am often wrong so if there is a way of spotting them close up I’d also like to know it.
I’m so very glad you said this Talla because I’d come to this tentative conclusion too. The only diagrams I can find which clearly show the P waves and S waves are of quakes recorded hundreds of kilmetres away. I haven’t been able to find a single diagram of a close-up quake where the P waves and S waves are discernible. I guess that what I find most annoying is that none of the literature actually points this out – grrrrr to them! Cheers to you! 🙂
DeepThought confirmed this in a post further down. 🙂
Oh yes, I’ve just seen it. 🙂
I think the next person at VC to claim they can see both P waves and S waves on an IMO drumplot quake should be politely asked to take a screen shot of said quake and use arrows to point out the two lots of waves! 🙂
Cool waves dude 🙂
Quite apt….
What does my avatar have to do with anything?
Your avatar is super cool! 🙂
Hi Bill, I love that picture. My son has a print on his wall.
Re-posting the link to the excellent recent footage of the eruption at Holuhraun, it is excellent & helps visualize what exactly is going on from the Mila cams. The lava breakout flow as shown clearly, and the massive & violent lava lakes in the craters is mesmerizing.
http://www.ruv.is/frett/holuhraun-eruption-fresh-video
Mesmerizing, indeed! You found the fittest word to describe it. 😉
Impressive!
We’d got another deep quake, ~14 hours before this post. This got me to thinking, has anyone done a slow time-sequence display of these quakes in 3D? It would be interesting (and possibly informative) to see what the quake progression was after that deep one. (Slow enough to allow thought-processes to occur between the display of one quake and the display of the next. Slowed proportionally to the actual times would be so nice.) This pic shows all the verified quakes from 14 hours ago until now.
http://tinypic.com/?t=postupload
OK, I was awake. Not. Here is the pic.

These deep quakes are interesting. We didn’t see them before the past week at any magnitude higher than 1 something. Now suddenly we’ve had three in the last week of magnitude 3+.
I posted yesterday (two days ago?) another deep quake with the drumplot data for it. It was part of a swarm, with a shallow-ish (6km) quake occurring as part of the same swarm, and definitely looked like a long period quake (magma injection into rock) on the plot.
Makes you wonder what the pressures are down there that we are now getting good sized quakes relating to magma injection into the surrounding rock at 15-20km deep. How shallow is the plume here? I was reading a while back that 20-25km, maybe, but some sources said it could be even shallower. Is this magma injecting right at the mantle boundary?
download dfms videos get
VLC media players free …..its what you need…… any speed play you want….. zoom etc etc
http://www.videolan.org/vlc/index.html
Thanks DT, I hadn’t thought there would be such a simple solution.
How Do I Read a Seismogram?
When you look at a seismogram, there will be wiggly lines all across it. These are all the seismic waves that the seismograph has recorded. Most of these waves were so small that nobody felt them. These tiny microseisms can be caused by heavy traffic near the seismograph, waves hitting a beach, the wind, and any number of other ordinary things that cause some shaking of the seismograph. There may also be some little dots or marks evenly spaced along the paper. These are marks for every minute that the drum of the seismograph has been turning. How far apart these minute marks are will depend on what kind of seismograph you have.
FIGURE 1 – A TYPICAL SEISMOGRAM.
So which wiggles are the earthquake? The P wave will be the first wiggle that is bigger than the rest of the little ones (the microseisms). Because P waves are the fastest seismic waves, they will usually be the first ones that your seismograph records. The next set of seismic waves on your seismogram will be the S waves. These are usually bigger than the P waves.
FIGURE 2 – A CROSS-SECTION OF THE EARTH, WITH EARTHQUAKE WAVE PATHS DEFINED AND THEIR SHADOW-ZONES HIGHLIGHTED.
If there aren’t any S waves marked on your seismogram, it probably means the earthquake happened on the other side of the planet. S waves can’t travel through the liquid layers of the earth so these waves never made it to your seismograph.
The surface waves (Love and Rayleigh waves) are the other, often larger, waves marked on the seismogram. They have a lower frequency, which means that waves (the lines; the ups-and-downs) are more spread out. Surface waves travel a little slower than S waves (which, in turn, are slower than P waves) so they tend to arrive at the seismograph just after the S waves. For shallow earthquakes (earthquakes with a focus near the surface of the earth), the surface waves may be the largest waves recorded by the seismograph. Often they are the only waves recorded a long distance from medium-sized earthquakes.
from http://www.geo.mtu.edu/
Good find……..this is fine if the quakes are in Europe ..the P fast & S slower wave seperates/spread out the farther from the quake……..were lucky to have a ring side seat 😉 placed inside the ring so both…… P&S arrive almost simaltainiously
Thanks for that, DT, it’s what I thought was happening and posted above in reply to a Mopshell comment. I also believed that the P and S waves arrive practically together in events close to the recording instrument. 🙂
This is the only conclusion that makes sense to me too so thank you, Talla. 🙂
Thank you for that clear explanation.
Could this figure add anymore clarity, or not? Specifically to the long gap / almost no gap between S and P waves?
I’m no expert at all. Experts, could you please tell if this picture is accurate or unusefull?
It’s from the book:
Volcanoes: Global Perspectives
Door John P. Lockwood,Richard W. Hazlett
I strongly suspect that the Fig 14.24 diagrams of non-volcanic seismic noises are strongly magnified as I can’t imagine that footsteps near a seismograph would register the same amplitude as an M2-3 quake or a surface gas explosion! Also, does the book explain the different causes of A-type swarms and B-type swarms? That would be interesting to know too. Thank you for posting this, Tsunami. 🙂
Your welcome! Unfortunately, I can’t answer your questions, Mopshell. After your question on P & S waves, I crawled the internet and stumbled upon these graphs. Not knowing if they were any good. But because it’s also listed on Volcanocafe links, I thought it might be worth while posting it.
Maybe schteve42 can help you, he posted a link to this book on:
https://volcanocafe.wordpress.com/2013/10/25/love-or-the-library-of-volcanic-eruptions-riddles/comment-page-2/
Sorry I can’t be of more help.
Oh honey, I really appreciate what you found and all the trouble you went to to post it. I’m sure many here appreciate it too! 🙂
Footsteps can create bigger amplitude waves than eqs, it all depends on some factors, specially the distance of the source..a footstep near a seismometer will create big “spikes”, a eq of Ml2.0 at 80km will create a small amplitude reading. A footstep is usually visible on a seismogram because it creates a “spike” around 5/7Hz, which is right on the middle of the frequency for local events and its not removed by filtering.
One day i recorded footseps (very easy to find) on my personal seismometer (located in my house) at around 4am, was a very very large cat or it was a “outsider” (…).
Wow! I didn’t realise this! Fortunately footsteps of man or animal is not something the seismographs have to contend with at Vatnajökull!
Just a comment. Presumably the P-wave shadow zone is because the waves are diffracted due to the core, imagine it as a big ball of glass and the p-waves as light. As a result the waves that just skim the surface of the core (ending at 103deg) hit in one place but those that just enter the core are diffracted like a lens and come out at the 143deg position. So you get a gap with no p-waves. Rather like looking upwards in a swimming pool and seeing a circle of ‘above water’, then a mirrored refection of inside the pool (although this is backwards, so to say).
I feel reasonably confident that I understand what P waves, S waves and L waves are and these are excellent diagrams showing that so thank you, Bill. 🙂
As for reading a seismogram, I’ve seen lots of these lovely diagrams but the reason I find them unhelpful is: (a) none of the quakes in these diagrams look anything like what we are seeing on the Vatnajökull drumplots and (b) all of the diagrams showing clear P waves and S waves are of quakes recorded hundreds of kilometres distant. I find it very annoying that the literature fails to mention that P waves and S waves are not distinctly discernible close up, if that is (and it certainly seems to be) the case.
Not to expert’s eyes, Mopshell. They can “read” those lines much clearer than us, mortals. In fact, that is one of the greatest abilities, both Carl’s and Jón Frimann’s. That’s why they own volcano blogs. (And I don’t doubt you could also have such a gift, if trained).
But seismicity is not the whole picture and one must be able to confront all possible information and data to get a picture of the whole.
That sounds about right to me. However, since they can be read by experts, why is there nothing in the literature about this? It seems to be something akin to a trade secret! 🙂
Trade secret? 🙂 Well, I wouldn’t go that far; literature alone can’t capture what experience of men and women dealing with volcanoes on a daily basis have been telling us for all these years. Dr. Boris Behnke, from INVG, is one of those who keep telling us not to trust solely in tremor graphs – even concerning Etna, his backyard volcano. Scientists are getting closer to understand them, but are far from admitting they can fully trace their steps without a certain dose of a “6th sense”… Who would dare put this into a book?
Ah yes, I see. Experts certainly do develop a sixth sense and it would be impossible to explain that in a book! Thank you for that. 🙂
I believe they should have at least some sort of good sense: what you would do if you were the volcanologist in charge and tremor graphs tell you that 35 000 people should be evacuated, knowing that either decision would cause life loss and public discredit? Well, that was the case with Sinabung.
Bill G et al.
Nice rumination upon seismic waves.
Actually, that is the basics to understand how scientists can draw a “picture” of magma chambers (such as Yellowstone’s). The method could be described as a “tomography” of the Earth’s lithosphere – not yet proved to be accurate and depending on the number of seismographs available for that specific region.
I haven’t seen such an image of Bardarbunga’s “guts” so far – probably due to the intricate web of inter-weaved dikes and sills which diverge the seismic signals.
As for those deep quakes under Kistufel, I wonder if there is the actual location of the spot above the deep mantle source or if it is just showing a region where more brittle rock is available. At those depths I could expect a “dead zone” sort of response under Bárdarbunga himself, therefore, no deep quakes underneath the caldera.
Actually, my take upon seismicity at this point is that EQ magnitudes are going down because the system is overheated and getting more ductile as time goes by – like what we see in Vedivön or Laki fissures SW of Vatnajökull.
The million dollar question is: what does it mean?
Is the present eruption waning down?
May old mush evolve and lead to an explosive phase?
Will ice/water melt infiltrate down to this boiling pot, with a similar result?
I have been comparing this eruption with recent Tolbachik’s in Russia, but we have a basically different situation here. And it has to do with Pyrite’s adagio: water! – Subducted slabs carry water from old oceanic crust, which in turn launch the process of partial melting, leading to more viscous magma, which hold gas bubbles etc…
In Iceland we don’t have that (I am not considering the Harper plate thing) – except for the water kept intact in the form of glacier – very hot and fluid (and gassy) magma sprouts directly from the mantle – so little to no change in its basic composition takes place – as we have seen so far.
Conclusion:
I don’t believe we will have time to see old Bardy’s mush become eruptable magma any soon;
Unless water/magma interaction occurs, no explosive eruption in sight (in shorter human time frames);
Since I don’t see much pressure in the form of lava fountaining at Holuhraun (resulting from the “plug”squeezing out the fluid magma from the mantle through the dyke), I believe that, at some point, the dyke will freeze along with the paths from the deep mantle – or else take a different direction.
I am not so sure that there is a feeding system directly under Holuhraun or the dyke. There is rifting, indeed, and magma rises from the mantle directly to “Bardy’s dungeons” – or else we would be witnessing a huge fissure event, not Irpsitadynga!
What may happen thereafter is anybody’s guess.
On Mila 1 there’s a light (a dot) that’s in the middle of the screen. Aircraft?
Seems like it’s staying put at the moment.
You’re not talking about that star are you? 🙂

What I saw was down more at the center of the screen and seemed to move a little.
It’s gone now.
Hello, first Time i post there so thank you all for all these interesting posts ans articles!
I’ve seen also a red glow in the center of Mila1 yesterday night (between 20:00 / 22:00), it was also visible on other Valdala cams… At the place of the old small vent i think… After it disapeared…
(Sorry for my english but i’m on france, Paris)
I saw that last night too….I thought it might be a helicopter, but it was stationary and was there for about an hour and a half.
Guess we’ll have to wait on Virtual again with his time lapses. 🙂
Perhaps maybe Virtual will catch it on one of the time lapses. Clouds may have given it the appearance of moving. What path would the star take that’s on the picture you showed? Would it head down in the direction to the center of screen? I went back and looked at what you showed before I posted this again. The time when I saw it 6:52 it would have went in the wrong direction by the time I saw your post. We’re facing south correct. I’m tired but I think it’s path would go in the other direction. 🙂
Also I didn’t see where it went or if it went. I think clouds may have covered the view.
Take a look at the vent on BB2 as dawn approaches and the hot vent becomes less over-exposed. Yesterday clear fountaining could be seen as the lava was brighter than the fumes. You can occasionally see it from the hot area immediately under the main breakout of the vent (towards the right).
Pic for those later
Blurry fountains (more obvious on video of course).
Yes I could see those lava fountains that you arrowed at around 11.15. I could also see some lava fountaining occasionally in the main vent, accompanied by wee puffs of dark material, some of which fell back down quickly. The eruption is looking a bit more vigourous.
It’s a pity it is so windy, the zoomed-in mila cam is very wobbly now.
I did not watch this morning, but there is a light moving in that direction already for a long time. I was always thinking it is Venus, because that planet can be seen until a bit after sunrise (and you could see that some weeks ago as well).
Except if it is changing it’s luminosity on a regular interval, then it could be a satellite, but I think it moves to slow for that. I was recording but haven’t seen it back yet myself.
HI Julienjj1 Glad to see you here. Sounds like we need to keep an eye on that area. 🙂
;-). Perhaps from the Eiffel tower i can see it… 😀
That would be something. 😀 I think now I’ll be seeing it in my dreams. I need to get some sleep. 🙂
Hiya Julienjji and welcome in to the VC! First rule here is to be nice to each other which you are already being! People on here are unbelievably friendly, even when they disagree with each other! And another phrase often used on here is that “there are no dumb questions, only dumb answers”! So ask anything you like (I even asked if volcanoes were male or female…..). Usually you get a sensible answer even if you know they must be thinking “whaaaaat?”. So come on in, have a volcanic coffee and relax…You are being brave, I couldn’t write on here in French! I even got Sweden and Norway mixed up yesterday!
And I wrote Julienjji, not Julienjj1. So that proves how daft (loco?) I am.
An updated summary of yesterday’s quakes – just the one added this morning but I did promise to re-post if any were added. 🙂
Subsidence measured on the glacier at B has been less than 0.30 cm a day for several days now.
Slowing down slowly.
Source IMO
I wish we had a recent and regular radar pass that looked at the rock elevation, not the ice surface elevation. I haven’t been able to figure out since this started how much subsidence is ice compaction, and how much is actual caldera subsidence.
Drumplots froze at 06:35 but are now running again – albeit with a great big blank between 06:35 and 10:17! 😮
That was during the troll and sharkano attack on the IMO facility…….
Aha! That explains it! We’ve been neglecting them so they are making their presence felt.
SHARKCANO!
Haaa Haaa! That is hilarious! 😀
Someone was asking about identifying P & S waves on tremor plots? You can’t, you generally need the raw waveform data to do that. Here’s me identifying a localish (100km) but very deep (160km) M4.4 on my own seismo:
(The waveform is actually a little peculiar, it may have had some kind of double focal mechanism as it almost looks like two quakes superimposed, but it’s the best example I had handy!)
Thanks, Mike! 🙂 I think also it’s only really possible to distinguish between P waves and S waves if the quake is recorded at a great distance. Up close, the two different waves arrive at virtually the same time.
I cant say a exact distance but i can find pretty easily P and S waves a eq at 15/20km distance from the epicenter, but it depends from different factors (noise, distance, depth, etc). Also you use 3 component seismometer, vertical component will give a higher amplitude P wave and the horizontal component will give a higher amplitude S wave, the horizontal component will have the higher amplitude says from which direction the S wave came (W-E or N-S), also usually P and S waves come in different frequencies, using a spectogram sometimes its pretty easy to find the P and S waves.
A eq at 1km from the epicenter with a depth of 1km, will be very difficult to pick P and S waves, like you said, they almost arrive together, there isnit enough distance to the S wave arrive later than the P wave.
A eq 1km of the epicenter, depth of 30km will have P and S waves separeted from each other.
A eq Ml1.0 at 100km at depth 1km, will be very dificult to pick up P and S waves, because it wont create enough amplitude waves to see in the seismogram.
Multiple seismic stations at diferent distances its required to get the correct information.
(Non expert opinion)
Just makes me more and more admiring of the folks at IMO – they really are extraordinarily good at what they do!
Hello folks,
Back with live video this morning, 😉
The super zoomed Mila2 showing fountaining from the main vent but is there also some plumes developing from the plain and hill beyond the vent?
Hello Colin, you back on dry land now?
Yes I was looking at those steamy looking things just above and slightly left of the main vent. The one on the black lump – must be a long way south of the main vent. Wondered if it was water vapour rising off the sunny side of the rock (snow melt on the warm rocks) but it looks too much for that.
If only the camera could keep still! It is freezing and pixelating quite badly now.
The disturbing thing is, if that really is new steam coming from the said black lump in the distance (actually south-west of the main vent), it is way off the line of the fissure/dyke.
Yes, for a couple of weeks or so it looks at the moment.
Of course the plain on the west side of the main vent is still dusty, so maybe it is down to funnelling dust laden wind up the hill. It is some way from where the earthquake action has been so I would not expect new vent activity to be exhibiting just there.
I thought I saw something going on along the line of the “graben” going up the glacier this morning, but it did not show up for long and does not seem to have repeated. This could of course have been some stray vapour going past from the mid field steaming area, which has picked up intensity today.
With the lava flow seemingly split up and no long pushing the lava field boundary further south. I am finding it quite interesting to try and pick where the next breakout will occur. Although I am a little surprised the hole in the middle lava field has not started to fill in the last couple of days
Actually this is a better example… here’s a 5.7 aftershock of last year’s 6.5 Seddon quake here in NZ:
It’s the biggest quake of this heavy swarm:
You can see how little you can see on a summary drum, as compared with raw waveform data.
Thank you Mike
Mike these are really nice. Even I can make some sense out of these. At least I know how they should look like in real world!
Cheers Mike! Thanks for sharing your data.
Mike
Thank you Mike!
Here is a quote from the latest Advisory board factsheet (as of 21 Nov 14) posted on IMO…
The volcanic eruption in Holuhraun continues to be strong. The activity is similar as it has
been for the last two weeks but the lava flow is more fluctuating. The lava flow forms an extrusion to the east southeast. From mid-September the productivity of the eruption has decreased.
Here is a quote from the IMO update on the same date …
About 30 events have been detected in the intrusion during the last 24 hours. Most events are still located in the northern part of the dyke intrusion, between the eruption site in Holuhraun and the northern part of Dynjujökull. However, during the past days several events have been located further south around the area where the dyke was halting before bending north around 23. August. This area has been rather inactive in recent weeks.
So either the eruption is starting to slow, or perhaps there is constriction in the dyke located near the bend? Anyone want to place bets?
I think the eruption has already slowed down a great deal, and unless it gets an extra boost it will stop soon. Would have been nice to get a little shield, though.
Oh! I bet that my eyes still work! I just have to say a “yay me!” And be glad I posted my suspicion. I have no idea what it means or what it will lead to though.
My bets are on a bit of both :)…. I know cop out
But I am beginning to think this is on the downside and the pressure in the fissure will drop and shut down.
This event has happened before, what we have seen is a result of BB getting a pinch from the rifting and springing a leak along an old dike, which it did a few hundred years ago in this exact spot. The leak will stop, the caldera settle and the pressure go back to where it was and the quakes will slowly cease
That’s my two cents and about all I am willing to bet on what I know 😀
Good, safe bet, Ian F! 🙂
I would however wage a reasonable bet (as long as it did not involve webcams) on an M5 quake in the south caldera within the next 24 hours . It’s time
It is quite likely from a “historical” point of view – if three months can be considered as such.
However, I still think that, somehow, rocks down there are getting less prone to respond to greater stresses, I mean, they are becoming more ductile – but that’s another layman’s opinion, and I have written the same without any further factual support . Or maybe it is all patterns that we tend to see and we are closer to fractal functions rather than pin-pointed ones… Oh, why pigs and sheep can fly?
It has come to the attention of Teams Blue and Red that there’s been funny business going on. Oh yes! When the drumplots shut down between 06:35 and 10:17 this morning, four M≥3 events were recorded by IMO (see IMO table of earthquakes); one of them was a Team Red M3.6 and THREE OF THEM WERE TEAM BLUE EQs INCLUDING AN M4.5!
What is obvious to all and sundry is that none of Team Green’s M≥3s were affected at all! It isn’t as though Team Green haven’t been absolutely dominant the last three or four days anyway – they don’t need any help to stay at the top of the leader’s ladder! So, could it be insider meddling by someone who has bet heavily on Team Green? Could it be political corruption? Impossible conspiracy theories fail to be rife! If Strictly Come Quaking had an authority (or any substance whatsoever), I’d be asking them to investigate.
I wonder how long it will take the Daily Fail to cotton on to this “scandal”? 🙂
Message from Team Gold. It wasn’t us. Honestly. No, really. Wouldn’t dream of doing such a thing. Ever. Now where did Harry The Hacker go…………
Though I am sure you have absolutely no ties whatsoever with this infamous criminal mastermind, GF, I have to say I suspected Harry the Hacker all along! This reeks of one of his nefarious get-rich-quick schemes!
I also want to assure everyone on the Strictly Come Quaking professional circuit, that the CEO of Team Green, the utterly delightful Frances, is completely above suspicion – a more honest, ethical and truly wonderful person you could not hope to meet!
LOL. ROFL
Aliens, I tell you! It is the little green men from Mars. They are responsible.
Oh Leslie, you have given my another mascot for team green. many thanks. 😀
Mopshell, perhaps you would like this video about reading seismograms! However, it is not as informative as one would hope…. but look at about 2.16, perhaps that is the reason for the many earthquakes…
done upon commentator’s request!
Oop sorry this is not what I wanted! Could any Super kind dragon remove that! This is completely different….
Could try the following:
http://volcanoes.usgs.gov/observatories/yvo/index.html
and there, find “An Illustrated Guide to Reading a Seismogram.” under Features, below the main article.
Um… interesting though this is, I think you accidentally posted the wrong video, Lapillus…
I’m thinking this might be the video you meant to post – I can certainly recommend it to everyone! 🙂
We’re taking donations for Red ink. Looks like they ran out of Gold, too.
Maybe they just need to refill their cartridges with lots of >3 >3 >3 >3
❤ ❤ ❤
Oh I’m happy to contribute more ❤ ❤ ❤ to your cause. 🙂
Pingback: New Eruption at Mount Pavlof | Explosive Earth
If this eruption eventually stops without an explosive event, what will we have learned from it?
Will it be because the dyke was too small to allow the system to depressurize and degas, thus preventing the explosive event? Will it be because the downward motion of the plug continued to apply pressure to prevent degassing? Or does degassing not matter?
Just trying to figure out what leads to a massive explosion of a caldera vs. what we are seeing here and how we can tell one form the other.
The plug is subsiding interactively with magma pressure from below. These balance each other out, so there should not be a net effect. While the volume is decreasing, internal conditions remain pretty much the same.
It’s all those other factors that create unpredictable possibilities.
New post is up: https://volcanocafe.wordpress.com/2014/11/21/happy-birthday-volcanocafe/