
Maui Nui Landsat Photo
The four islands between Oahu and the Big Island of Hawaii are the remnants of a large volcanic edifice, referred to as Maui Nui, literally Big Maui. At its height some 1.2 MY ago, it was about 50% larger above sea level than the current Big Island of Hawaii. Following that peak the normal cycle of landslide, erosion and subsidence divided Maui Nui into its current four separate islands of Molokai, Lanai, Maui and Kahoolawe. This piece will give a short geologic history of those islands.
Volcanic activity on all the Hawaiian Islands has four stages of activity classified like that on Kauai. These include preshield (sub aerial) which is primarily alkali lavas; shield (aerial); postshield (alkali); and rejuvenated (alkali). For all these islands, the preshield and shield building lavas comprise the vast majority of erupted materials. Preshield builds the island from the ocean floor. Shield building builds the island above the ocean surface. Postshield takes place at the end of the shield building stage and normally fills the caldera. Rejuvenated takes place some hundred(s) of thousands of years after the main eruption stops and is characterized by cinder cones, phreatomagmatic and similar eruptions. Rejuvenated eruptions emit by far the smallest amount of lavas by volume in construction of a Hawaiian Island.

Stages of Hawaiian Volcanism
It is also important to note that all the Hawaiian Island sit in a pretty strong band of trade winds blowing generally east to west. This means that the upwind side of the islands is very wet, generally covered with tropical rain forests. Rainfall increases as the water-laden air mass is forced higher up against the volcano. On the lee side, the air mass is drier, and drops successively less rain as you get farther away from the central volcano. On most islands, the windward side has sufficient rainfall to support tropical rain forests, while on the lee side, it supports vegetation more appropriate to the deserts of West Texas. Cactus is not uncommon on some of the islands.

Rainfall Patterns of the Main Hawaiian Islands
This distribution of rainfall is important in the evolution of life on Maui Nui and explains a lot about what is seen on the islands today.
Growth
Initial growth of the island appears to be a single shield volcano underlying Penguin Bank, which sits between the island of Molokai and Oahu. Molokai sits some 42 km east of Oahu. The shield volcano underlying the Bank started building some 2.2 MY ago and was briefly connected to Oahu as the next expression of the hot spot that created the string of Hawaiian Islands. Today, the top of the volcano sits some 60 m below the surface of the Pacific and is topped with coral.
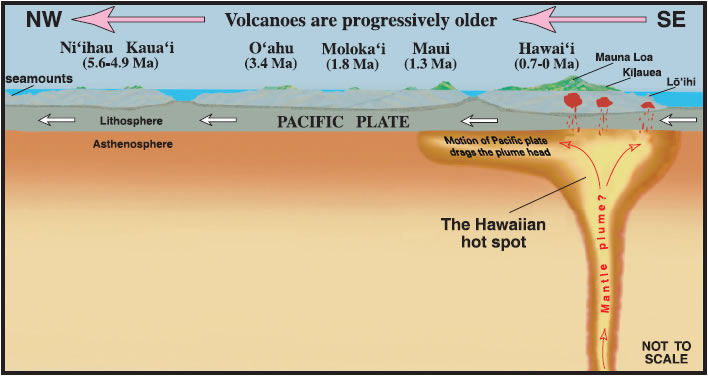
Schematic of the Hawaiian Hotspot
The next island to start forming was Molokai, which is the northern most of the remaining group. The western most shield volcano started forming West Molokai some 1.89 MY ago. The western volcano started some 1.52 MY ago. Normal shield growth only takes some 200,000 years for each volcano given estimates of island growth for Kauai and Hawaii.
Yet another set of vents erupting out of three rift zones formed the island of Lanai south of Molokai with major activity between 1.46 – 1.2 MY ago. Lanai was connected to Molokai by the shared volcanic edifices. Lanai is a single shield volcano.
Simultaneous with eruptions forming east Molokai and Lanai, the volcano forming West Maui was active some 1.6 MY ago. It is now considered extinct. The East Maui volcano – Haleakala – became active some 800,000 years ago and had its last eruption of rejuvenated magma some 200 – 500 years ago.
The final active volcanic center, and smallest island is Kahoolawe which is a single shield volcano active some 1.03 MY ago. It now sits some 10 km south of Maui.
The Pacific Plate continued to move and with it, the activity continued to move southeast relative the existing islands. The oldest volcano making up the current island of Hawaii is Kohala, which was active some 1.00 MY ago, breaching the surface some 500,000 years ago and erupting for the typical 200,000 years. It sits some 50 km southeast of Maui.
At its largest some 1.20 MY ago, Maui Nui was some 14,600 km2 above water.
Destruction
Now that the growth of the larger island of Maui Nui is moderately nailed down in terms of shield building, next comes its destruction via a series of landslides, subsidence and erosion.

Evolution of Maui Nui
The connection between Molokai and Penguin Bank was broken some 700,000 years ago. The connection between Lanai and Molokai opened up some 600,000 years ago. The connection between Kahoolawe and Maui opened up some 150 – 200,000 years ago. Maui, Lanai and Molokai have been intermittently connected since then, mostly due to variable sea levels due to glacial episodes during ice ages. One article estimates the islands were connected as recently as 18,000 years ago due to the lower sea levels during the last great ice age.
Note that the reason the islands are no longer connected is because of the subsidence of the entire structure at the rate greater than 3 mm / year. There is a drowned reef line around Molokai some 400 m below the surface that rises around 30 m from that depth.
Landslides

Landslides Around Maui Nui
There are three main landslides / slumps associated with the greater structure. The difference between a landslide and a slump is velocity. Landslides move very quickly, often creating tsunamis, typically spreading debris tens to hundreds of kilometers on the ocean floor. Slumps are much slower, do not necessarily create tsunamis, and do not necessarily deposit material on the ocean floor or nearly as far along the floor should the debris reach that far.

List of Known Largest Hawaiian Landslides
The first and largest slide was the Wailua Slide, which appears to have taken the northern half of the East Molokai shield volcano down to the bottom of the Pacific with it. It covers some 13,000 km2, is just under 195 km long and 40 km wide. The failure took place when the volcano stood some 1,300 m higher than today.
Around 2,500 km3 of Molokai fell off toward the north. Its source is a 40 km wide amphitheater that took most of the northern half of the East Molokai volcano. The landslide was relatively high speed as debris climbed out of the Hawaii Deep, the depression the mass of the Hawaiian Islands created in the Pacific Plate as magma is transferred from the mantle to the surface. During its runout, the debris flow climbed some 300 m uphill before it stopped.
The landslide appears to have taken place around 1.4 MY ago and generated a tsunami between 600 – 700 m locally on Molokai and Lanai. This height is verified by the presence of corals high in the mountains of the island.
Note also that due to subsidence, the scarp face the landslide released from is now well below the surface of the Pacific. http://www2.hawaii.edu/~nasir/083Molokai.ppt
A second slide is the Hana Slump, which appears to take place from an active underwater rift zone called the Hana Ridge. This ridge reaches east from Maui and crosses the northern end of the Big Island. At its end, there was a debris slump covering some 4,900 km2, measuring some 85 km long by 110 km wide. Given the proximity of multiple debris slumps north from the Big Island and the Kohala Volcano, the area is fairly complex. Age of this slump should be on the order of 500,000 years. I have not found any associated massive tsunamis with this feature. http://www.agu.org/books/gm/v128/GM128p0011/GM128p0011.pdf
The final massive landslide if the Clark Slide out of Southwest Lanai. This feature is bound mostly by the Penguin Bank to the north and proceeds mainly south and west in two lobes. It is tentatively set at around 650,000 years old based on a successive series of coral reefs around Lanai, the lowest some 1,000 m below the surface of the Pacific. The head of the avalanche has the typical amphitheater shaped source where part of the island calved off downslope to a bottom some 3.5 km below the waves. Original dating of tsunami debris attributed to the slide had to be reevaluated as the debris was dated at some 105,000 years ago which has now been tied to the Alika debris avalanche off the west side of the Big Island. http://walrus.wr.usgs.gov/reports/reprints/Moore_JGR94.pdf
Molokai
Molokai is roughly rectangular in shape, with the two volcanoes on the ends with a saddle in the middle. It is oriented east – west. The island is 670 km2 in area, hosts a population of some 7,300 and tops out at the eastern volcano at some 1,500 m.

Sea Cliffs of Molokai
Both volcanoes were built by layered basaltic lava flows once the edifice broke the surface of the Pacific. The layers measure from less than a meter to some 25 m thick. They are separated by soils and ash some centimeters to one third a meter thick. The Eastern Molokai Volcano is topped with a caldera that used to measure some 7 km in diameter. There has been massive erosion on the flanks before and after the flank collapse that removed the north half of the eastern volcano exposing numerous dikes on both volcanoes.

East Molokai Volcano
There are cinder cones and spatter cones on the western slope of East Molokai from the final stage of volcanism. There are the remains of at least one cone created by a phreatomagmatic eruption at Mokuhooniki a couple kilometers off the eastern end of the island.

Phreatic Eruption Cone – Rejuvenated Volcanism
Postshield lavas are rare on the older, western volcano. However they make up a substantial volcanic unit on the eastern volcano. The majority of the final volcanic episodes built cones and flows on the north shore of Molokai, one of the episodes forming a peninsula hosting a former leper colony. There was also at least one lava tube associated with this structure. http://pubs.usgs.gov/misc/stearns/Molokai.pdf

Kalaupapa – Rejuvenated Shield Volcano
Early settlers mismanaged livestock on the island to the point where the dry western end of the island was mostly stripped of vegetation. Since then, has been poorly regrown and suffers substantial erosion.
Maui
Maui is the largest remaining island of this grouping. It is just under 1,900 km2. The eastern volcano, Haleakala tops out at over 3,000 m. Maui hosts a population of over 140,000 and sits some 50 km west of the Big Island of Hawaii.

Landsat Photo of Maui
As with Molokai, the western volcano is the oldest while Haleakala is the youngest vent. The isthmus connecting the two volcanoes was built chiefly by lavas out of Haleakala. Both mountains are constructed by multiple layered lava flows during the shield building stage, interspersed with thin layers of soils and the occasional ash deposit. http://pubs.usgs.gov/misc/stearns/Maui.pdf
The Hana Slump is the closest known landslide associated with Maui, though the velocity of the collapse does not appear to be significant. Note that Maui is a lot like the original shape of Molokai before the eastern volcano calved and slid north.
As with all Hawaiian Islands on the windward side, Maui generates a significant amount of rain as it wrings water out of the trade winds forcing them up the slopes of the volcanoes. On the windward side of Haleakala, over 750 cm of rainfall yearly is not uncommon. On the lee side, there are places that average 40 – 50 cm per year or less. Droughts are not uncommon with significantly less rainfall than that.

Map of Young Lava Flows on Haleakala
West Maui Volcano is the oldest, having gone through all three aerial stages of Hawaiian volcanism. Its highest point is some 1,700 m above the shoreline. It is constructed primarily of layered basalt flows which are heavily weathered and present spectacular cliffs to the ocean. Following the main shield building phase, it went through a series of postshield eruptions which filled the 5 km diameter main caldera mostly with lava. The final phase was the rejuvenated eruptions which ended some 500,000 years ago.

Panorama of Haleakala Crater
The East Maui Volcano, Haleakala is the most recently active Hawaiian volcano not associated with the Big Island. It has at least ten eruptions over the last thousand years, and numerous over the last 10,000 years. Magma being erupted is of the rejuvenated variety. The most recent eruption is thought to be somewhere between 250 – 500 years ago. The volcano is thought to have been originally about a kilometer taller than it currently is. Most of that loss of height is thought to be due to erosion.

Map of Recent Activity in Haleakala Crater
The volcano itself is once again a layered basalt mountain, though this one is claimed by some as the largest single volcano in the chain in terms of sheer volume. It is topped with a crater that measures some 3.5 by 12 km. Interestingly enough, geologists do not write of this as a caldera, as it is breached on either end by valleys carved by erosion. Recent activity in the crater has created an array of spatter cones, cinder cones, basalt flows in the crater and flows reaching downhill to the north and south of it to the sea. http://hvo.wr.usgs.gov/volcanoes/haleakala/

Cinder Cones in Haleakala Crater
Other rejuvenated volcanism within the last 1,500 years has taken place at the western edge of one of the rifts that make up Haleakala, with flows southwest to the sea. There is another region at the far northeast corner of the island associated with the east rift zone has many small cinder cones that have covered an area of the island with new lava. The east rift zone slopes down into the Pacific and becomes the Hana Ridge mentioned earlier as a source of a slump along its northern slopes. It is named after Hana, which is on the eastern tip of Maui. Haleakala is considered an active volcano for planning purposes. http://hvo.wr.usgs.gov/volcanoes/haleakala/newmapping.html

Dragon’s Teeth – Rejuvenated Lava Flow Maui
Lanai
Lanai is the remains of a single shield volcano which erupted from three rifts arrayed around the central vent / caldera. It is roughly egg-shaped and sits some 15 km south of Molokai and 14 km southwest from Maui. As such, it is well shielded and protected from the trade winds and the moisture they carry. The island is some 364 km2 in area and supports a population of just over 3,100 per the 2010 census.

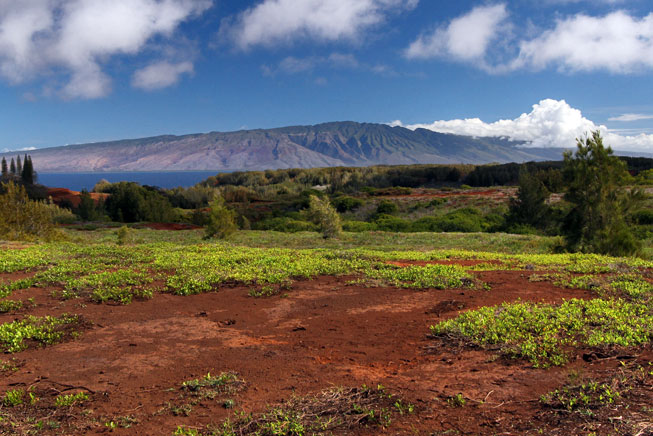
Map of Lanai and Molokai
The central volcano tops out just above 1,000 m and supports a pair of calderas, one large and one small covering a combined 10 km2 in area.
Lanai sits on the lee side of Maui, so is drier than many of the other islands. The windward side of the island gets some 96 cm of rainfall yearly near the summit and 25 cm near the lee side coast. The primary crop is pineapple and sugarcane, both of which are being phased out in favor of tourism. Like Molokai, initial settlers allowed livestock to run wild for a time. This along with the drier climate made rebuilding of the plant coverage difficult.
Lanai Central Volcano
Like Molokai, the shield building stage comprised of multiple layered basaltic lava flows interspersed with thin layers of soil and the occasional ash deposit. Because of the dryness of the island, spatter cones, pits and other normally observed rift zone and caldera lava sources are still easily found, with some 47 locations on the island. Think of Kilauea as the current example of this sort of volcanic activity.
There was no postshield magma emplacement found. And Lanai did not get any rejuvenated volcanic activity.

Boulders at the top of Lanai Volcano
Early geologic surveys of Lanai found limestone, corals and other debris rather high in the valleys and the slopes of canyons carved by rainfall. These were misidentified as being due to massive changes in the height of the island above the ocean. As it turns out, the majority of these deposits were all brought ashore courtesy of tsunamis generated by the multiple massive landslides around this part of the Hawaiian chain. http://pubs.usgs.gov/misc/stearns/Lanai_and_Kahoolawe.pdf
Kahoolawe

Kahoolawe Map
Like Lanai, Kahoolawe is also the remains of a single shield volcano. It sits some 11 km south of Maui and 27 km east of Lanai. It is some 116 km2 in area and stands just over 450 m above the ocean. It has no permanent residents.
Like Lanai, Kahoolawe, was built by multiple layered basalt flows. Unlike Lanai, it is not high enough above the ocean to generate significant rainfall, averaging 25 – 60 cm per year, a semi-arid climate for this part of the world. It is also among the windiest of the Maui Nui islands and stands in the rain shadow of Maui. Wind is the primary erosive force on this island.

Airborne View of Kahoolawe
There is a central caldera on the eastern end of the island measuring around a kilometer in diameter. All three aerial types of volcanics are identified on this island, with the postshield mostly filling up the main caldera. Following an extended period of inactivity, rejuvenated magma eruptions did occur on several places on the island. There is no significant flank collapse associated with Kahoolawe, though tsunami debris is present on the entire island.
Goats were introduced onto Kahoolawe by Captain Cook in 1788, sheep in the mid-19th Century. These animals denuded the island of most of its native greenery, which is suspected to be mostly grasses, bushes and scattered trees. Once the vegetation was gone, the soil followed, being blown away by the constant winds. An estimated 1 – 3 m of soil was lost from the summit and left some 40 km2 of the island stripped all the way down to the weathering basalt lava flows. The goats and most sheep were killed off in 1918 and owners have started trying to reclaim the vegetation.

Downwind Denuded Portion of Kahoolawe
During WWII, Kahoolawe was turned into a gunnery range and impact area for Navy and Army Air Corps training. It was used for that purpose for over 30 years until Hawaiians decided it was sacred and the weapons training needed to stop. It was turned back over to the State of Hawaii in 1994 along with a military cleanup of exploded and unexploded ordinance. It has been turned into an Island Reserve for Hawaiian cultural purposes and agricultural remediation. This is probably the saddest single Hawaiian Island. http://pubs.usgs.gov/misc/stearns/Lanai_and_Kahoolawe.pdf
Conclusions
As we saw with the geologic history of Kauai, once the island is formed, it dissolves back into the ocean in a relatively short period of time. Total lifespan of these four islands has been around 2.2 MY from the first shield volcano built at Penguin Shoals west of Molokai. There were another five eruptive centers, making Maui Nui similar to the Big Island of Hawaii in construction. Want to see what the Big Island will look like in a few hundred thousands of years? Look no farther than 50 km west to the former Maui Nui.

Maui Shore Line
/ Agimarc
Past VC Columns on Hawaii
https://volcanocafe.wordpress.com/2014/10/20/a-short-geologic-history-of-kauai-hawaii/
https://volcanocafe.wordpress.com/2014/06/20/the-volcanic-landmarks-of-oahu-hawaii-part-1-diamond-head/
https://volcanocafe.wordpress.com/2014/07/08/the-volcanic-landmarks-of-oahu-hawaii-part-2-punchbowl-crater/
https://volcanocafe.wordpress.com/2014/07/25/the-volcanic-landmarks-of-oahu-hawaii-the-conclusion/
Additional Reading
http://hvo.wr.usgs.gov/volcanowatch/archive/2003/03_04_10.html
http://www.soest.hawaii.edu/coasts/publications/hawaiiCoastline/molokai.html
http://archives.starbulletin.com/2003/05/12/news/index2.html
http://www.soest.hawaii.edu/coasts/publications/hawaiiCoastline/lanai.html
http://www.agu.org/books/gm/v128/GM128p0011/GM128p0011.pdf
http://walrus.wr.usgs.gov/reports/reprints/Moore_JGR94.pdf
http://www.ifa.hawaii.edu/haleakalanew/LRDP/images/AppendixA.pdf


In case anyone is interested, all the quakes for the entire year 2013 at BB
All Quakes leading up Aug 11th 2014
Hi Ian,
Nice graphs, the second one is all eqs up until 11/8/14, from when? 🙂
Sorry, from the Week 1 of 2014 to Aug 11th
This is all quakes from Aug 11th to present just so it can be compared easily, note the area on the North East away from the caldera that had activity for such a long time and as soon as the breakout happened, almost nothing. No explanation, just observations.
Brilliant series, Ian F.
Maybe it’s because that part of the american plate which is east of the caldera in my video (BBglidnar203) broke of in August 16 2014 ?
Ok, then the stress is transfered to the north side of BB caldera when it is no longer attached?
Thank you Ian F. I can remember all last year (and before) little bursts of activity around BB and “The dead Zone” and our discussions that there seemed to be “Something happening” .
I could go back and root out some of the comments but I am too tired tonight . It would take some time to hunt them down.
After watching Gudmundur Jonsson’s video, when I look at the location of the quakes I wonder … perhaps Hreppar isn’t puncturing the area under Bardarbunga …
What if the crust under Bardarbunga is very dense (to best illustrate what I am saying, I will call this a “rigid mass”, although of course it is not actually rigid.)
What if the force pushing Hreppar is not enough to split open the rigid mass?
What if Hreppar is thinner — does not go as deep as the rigid mass?
What if the area around Bardar — around the outside of the rigid mass — was pliable and would split under the force from Hreppar?
Then as Hreppar applies horizontal force to the top of the rigid mass, the area around the outside of the rigid mass yields as the rigid mass is pushed over. The side closest to Hreppar (SW) will rise slightly, and the one furthest away (NE) will sink.
Yes, this is a whole lot of “what ifs” and it simplifies the problem almost to the point of ludicracy. But this is what I saw when I looked at the picture above. (No, I lie. First I thought it looked like someone was using a spatula — American word; don’t know the English one — to remove Bardarbunga from the picture and was having to lever it out of there. But that would have the N side rising and the S one sinking.)
One thing I didn’t like about my theory is that the quakes are N and not NE. Then I remembered that Hreppar has counterclockwise rotation, so its force is both NE (as appears in Gudmundr’s video) and NW (from rotation), so the “far side” of the rigid mass would be more N than NE. 🙂
It would be neat if I am “on to” something. As long as you don’t think I am “on” something 🙂
Here’s another one for you: what if the experts are right in their interpretations of the GPS movements?
Mopshell, I haven’t seen any IMO-type interpretation of the GPS movements. I would love to see / read it.
“Ian F November 13, 2014 at 22:51
Ok, then the stress is transfered to the north side of BB caldera when it is no longer attached?”
Yes ?
It does fit the observations.
Now, VON moving east and south instead of west, is this just a local thing or do you have ideas on this movement? It did start to move West early on for a while.
“Ian F November 14, 2014 at 00:05
Now, VON moving east and south instead of west, is this just a local thing or do you have ideas on this movement? It did start to move West early on for a while.”
“BillG November 13, 2014 at 02:27
Maybe the motion of VON reflects Both plate tectonics (left) plus plug SINKING (right).”
I think BillG is on the right track there. VONC is so close to the caldera fragment that we always see activity there as a result of magma, water and debris filling (or not fillling) the void
From a distance, this looks like my fried egg this morning. 😀
WQith lots of pepper on it? 😀
Just a dash of pepper in my case. 😀
Congratulations to Team Green! What a fantastic effort! I had a feeling your team were planning something big and this had that wow factor alright! 😀
Pictures and article from the Icelandic Civil Protection from flight on 11th November:
http://avd.is/is/?p=1217
They had planned fly up to Bardabunga to help with the GPS but it wasn’t possible to land so it was just four men on the snowmobiles.
That’s fascinating! Would love to see more photos of Bárðarbunga. Hopefully more will be released in the next few days. What a great job they all have! Risky yes, but soooo exciting!
I have two questions in regards to the last few day’s activity. Maybe someone can help me 🙂
1. With the repositioning of the GPS, is the substantial decrease in vertical movement (0.75m over 3 days) a result of the repositioning or a result of actual change in the caldera subsidence? That is, was the reposition directly up in the same spot, or did they move it sideways to possibly different subsurface structural location that is impacted differently by the subsidence? I find it an awfully convenient coincidence that the reduction in subsidence occurred at the same time as the GPS de-snow-drifting.
2. It seems to me that a lot more quakes are showing up on Baering’s site today. I noticed in the past that IMO often had a lot of quakes that never showed up on his site, but I never kept much track of how many. Is today’s increase on Baering’s site actually related to an increase in the number of quakes, albeit smaller magnitudes than the daily peek over the past few weeks, or is it simply Baering’s site showing more of those that occurred?
Thanks!
Don’t know about 1) but there do seem to be more 3+ earthquakes today – and IMO seem to have somebody on night shift tonight keeping up with them, so nearly all the quakes that show up are being manually confirmed very quickly.
Whoa…just had a verified 19.2km deep mag 3.1 quake directly under Bardarbunga. That’s the deepest quake I recall seeing during this event.
I was going to post the same comment but as an occasional lurker, was looking for some records. That’s deeper than the “upper chamber” drawings I’ve seen.
Could be from the walls of the lowest reservoir, the one which is fed directly by the mantle, which is located at approximately 20-25 km depth. It may have been set off by a new, big influx of fresh magma.
We have seen this before, I remember thinking to myself it is like the roof of the chamber is collapsing
Back on October 26th and then came the M5.3 on the south side and it all went dead quiet for 15 hours, lets see if it happens again 🙂
These big SE quakes are worryingly located under the south half of the caldera structure. Reminiscent of a slow trapdoor collapse toward the north. I think it is too early to give up on this idea in favor of only a relatively quiet extended period of shield building at Holuhraun.
1. Looking this morning at the GPS graph it even was less than .75m. After the flat ‘off period even an uptick was visible. This afternoon or so the graph was corrected I think, the uptick has gone. Corrected to take out the false lesser subsidence. It is the subsidence that is measured, so when the GPS reader has been put in a somewhat higher place, IMO had to adjust the graph.
Not quite correct maybe, because at the time the GPS was ‘off’ the subsidence went on, not known how much though, so not in the graph.
2. I don’t know, but I had about the same thoughts.
That’s a lot of quakes in the last 20 minutes!
First one (the big mark at about 23:09) is showing as mag 4.7, unverified, surface.
@Ian F: thank you for posting the EQ information.
You are very welcome 🙂
I do not know if the number, intensity or depth of all of these ongoing quake swarms is concerning or is it the fact someone is working overtime at IMO to watch them ? LoL
Probably a bit of both. Was looking (in my geographical ignorance – pardon to scientists) at the historic 4+ earthquakes thinking: now the last bit of the line will be drawn from Bárðarbunga to Hekla. In the coming years the EQ pounding will be there, whether Bárðarbunga has a hissy fit in the meantime or not. But if it does have a hissy fit, it might simmer down for a bit, wipe its red face and then stretch out its hand to Hekla for a shake. Perhaps, as with space travel, the peripheral knowledge we gain while focussing on one point, may be the real advantage / lesson to humankind. We don’t see the wood for the trees. Maybe our aggressive efforts to show down and be one up on others is the very reason for our survival? With peace may come complacency? Horrible thought.
http://nypost.com/2014/11/12/authorities-might-dynamite-self-exploding-dead-whale/
This isn’t going to turn out so good.
Similar tactic in Oregon:
why didn’t they drag it out to sea and let nature take care of it ?
I don’t think that crossed any one’s mind. After all, the Department of Transportation (DOT) was in charge. Since it washed ashore, they probably figured that it would wash ashore again.. outside their area of authority, and someone else would get the publicity and subsequent funding boost in dealing with it. After all, it is a government agency.
http://www.adn.com/article/20141112/alert-level-raised-alaska-volcano-spits-out-ash
Pavlof Volcano rumbling again.
I haven’t been been doing much talking lately but really enjoyed this read. Moloka’i to be quite interesting in that it has eroded to that point where it is now underneath the ocean at that depth. It is an interesting cycle that the Hawaiian go thru.
http://youarenotsosmart.com/2010/09/11/the-texas-sharpshooter-fallacy/
I do hope you all have read GeoLurking’s link above. Its vital and in some sense distinguishes homo-rationalis from homo-instinctive.
Random isn’t ‘even’ or ‘average’. The starts in the sky are random, but we see all sorts of patterns.
Here’s a sute:
http://www.random.org/
and a random number: 29030811
And remember that in a group of about 30 people the chance of two having the SAME birthday is about 50%!
On the other hand
https://www.wallenberg.com/kaw/en/research/quest-random-patterns
The chaos is the greatest creative force in existence. Even the simplest manifestation, an infinite random sequence of zeros and ones will have this property. Something describing you without warts, you with warts,
your entire life, the history of the world, many other possible histories of the world, alien worlds and the entire human literature of the future will all occur in due time, albeit very remote time and will repeat themselves according to precise laws.
It should therefore not come as a surprise that to produce such a sequence may just be the hardest thing possible, purely devine, not remotely possible for human beings.
I only ever met three people with the same day/month of birth, I have been on this planet for many years, % would be …
I once went out for brunch in a smallish city and at the restaurant ran into the two other people I’ve met in life who were born on exactly the same day as me (same day/month/year). Each had randomly gone out to brunch with different sets of friends and ended up at the same place.
Another time in my 20s, I ran into a Danish woman in California who I didn’t know but after a lengthy discussion we discovered that she had briefly met me in Copenhagen when we were children (she was having a playdate at a friend’s house when a large American family came calling to see the friend’s family).
Both random events, no patterns, purpose or guiding hand. But sometimes the sheer happenstance of existence kind of boggles the mind.
On the other hand, I could well have been in the proximity of others born on exactly the same day as me (but not known it) many times in my lifetime. And since I live in the same urban area where I spent most of my childhood, I probably often walk by people who I had fleeting conversations with in a different stage of my life. I just don’t know it…
That’s NOT the same thing as 2 people in a group of 30 people having the same birthday.
Barring your are 29feb only in in 365 will have your birthday.
The above is the chance that ALL 29 people do NOT have the same birthday as ALL individually (IYSWIM).
For one there are 29 birthdays for each to choose from, and you go from there.
for statistics to work the chance needs to exist that you throw 20 x a six wtih a dice in a row….
Really a great article. A lesson to fellow lurkers who draw conclusions on skimpy data. We all are guilty of this to one extent or another. But it is better to study and hypothesize than accept the common belief mindlessly.
Agreed ….always question ….always ask…..always seek out the truth …..study and hypothesize and act……else your a compliant taxpaying sheepie like the PTB want…….at BB should you look closely …not much of what’s going on is random ………everything complies to Newtons Law …… for every action their is a equal & opposite reaction or reactions…..for every reaction their is a equal & opposite rereaction or rereactions….etc …etc
Excellent! This should be required reading for everyone, particularly those inclined to conspiracy theories and “we’re all going to die” theories based on little or not-proven evidence. 🙂
but …. but …. we ARE all going to die… aren’t we?
GL Edit: Good one! You beat me to it. 😀
maybe not all at the same time perhaps.
Yep! I’m certainly convinced that I’m going to die. 🙂
Well not me Mopsey! I’m going to become a ghost and haunt everyone :p At least I hope I can
LOL! Yes, we are all going to die but, as you say, probably not all at the same time.
I don’t know about you, but I’m planning to live forever.
Interesting stuff, the laws of probability can be counter intuitive, but here is something related but different. It’s an excerpt from a documentry by Marcus du Sautoy called “The code”. I really enjoyed this series.
doubt that the wisdom of our crowd is going to tell us what will happen.
And, I have heard it said that the intellectual capacity of a mob is equal to the lowest IQ in the group divided by the number of participants.
With regards to the crown as a whole getting the guess right, pretty astounding. However, do note that one of the original purposes of the Gaussian curve (aka Normal distribution) was as a way of refining errors in measurement. In this case, each guess is a “measurement”
Question: Where are those surface cauldrons on Bårðarbunga? On the caldera side that is tilting more, or on the side that is tilting less? Or none of the above?
I’m not completely clear on this but from what I recall of Magnus Tumi Gudmundsson’s report, they are located on the rim in the north-east quadrant and in the south.
Perhaps ‘deeper’ not ’tilting’.
Mhm. Stupid question? Perhaps I misunderstood and the caldera is more or less level after all.
There are no stupid questions, Hen. Only stupid answers.
I’d like to help, but I don’t know.
Thank you Tsunami, I read about it somewhere but can’t remember where. Too much fast reading lately.
It would make sense that, with the subsidence, there would be tilting in the caldera now. On the red sink map which Ian F used as an overlay on his Bárðarbunga map, the tilt downwards appears to be in the north-north-east (area of greater subsidence) while it is higher in the south-west.
BBGN, I am having an early night, a spring day with 35 deg, not looking fw to summer
Where are you Ursh? Goonight.
BBGN Ursh, Nice to see you here again! Hope all your dogs are OK. 🙂
hi Talla, things are the pits as far as my pc goes, I am hanging in there and will hopefully get a new one next year, it has been a steep learning curve. My dogs are doing fine, there is always something happening, but I cope had plenty of experience, even so one of my bitches had an emergency cesar, the vet had never seen anything like it, but things are ok now.
I know the infrasound is affected by the storm, but I have ask why only two stations are going crazy?
they “could” be all tizzy over a upcoming EQ 🙂

bookymark linky
xxxhttp://en.vedur.is/weather/observations/radar/
xxxhttp://en.vedur.is/weather/observations/areas/
Good Morning,

The view just cleared on the MOGT cams on Vadalda
Could this be lava starting to fill the river channel or is it melt water?
It almost looks like a bit of black lava sticking its tongue into the picture (South). Clearer now for both South and West. Even a spot of fire in the distance.
Mila1 & 2 also clearing. Could even see a spot of fire on 2 in the distance.
Even looked like an occasional fountain above the lava lake.
BB GPS Station………brave & dedicated team


BB look’in desolate inhospitable
from http://avd.is/is/?p=1217
So right DT, they deserve medals and more for what they are doing and risking!
Yesterdays larger quakes in/around B., the list is much longer than we’ve seen in days.
13 M4+ but no M5+,
and 22 M3+
Quakes often did occur in a short period, most impressive was the period 8.26 – 8.59 with 8 M3+.
Thursday13.11.2014 23:08:43 64.675 -17.439 3.7 km 4.8 99.0 5.8 km NE of Bárðarbunga
Thursday13.11.2014 20:46:18 64.652 -17.533 3.5 km 4.9 99.0 1.3 km N of Bárðarbunga
Thursday13.11.2014 19:55:47 64.680 -17.509 7.2 km 4.1 99.0 4.5 km NNE of Bárðarbunga
Thursday13.11.2014 16:50:22 64.665 -17.369 8.6 km 4.4 99.0 8.0 km ENE of Bárðarbunga
Thursday13.11.2014 16:44:03 64.673 -17.463 0.0 km 4.0 99.0 4.7 km NE of Bárðarbunga
Thursday13.11.2014 15:18:19 64.674 -17.442 9.1 km 4.0 99.0 5.5 km NE of Bárðarbunga
Thursday13.11.2014 12:33:08 64.661 -17.526 8.7 km 4.0 99.0 2.3 km N of Bárðarbunga
Thursday13.11.2014 11:31:05 64.619 -17.341 10.8 km 4.4 99.0 9.2 km ESE of Bárðarbunga
Thursday13.11.2014 11:06:55 64.671 -17.461 4.0 km 4.1 99.0 4.6 km NE of Bárðarbunga
Thursday13.11.2014 08:30:12 64.667 -17.388 3.0 km 4.5 99.0 7.2 km ENE of Bárðarbunga
Thursday13.11.2014 08:26:48 64.673 -17.451 7.6 km 4.2 99.0 5.1 km NE of Bárðarbunga
Thursday13.11.2014 01:39:36 64.671 -17.456 3.0 km 4.0 99.0 4.8 km NE of Bárðarbunga
Thursday13.11.2014 01:18:28 64.664 -17.511 0.1 km 4.7 99.0 2.7 km NNE of Bárðarbunga
Todays checked M4+ till now:
Friday14.11.2014 08:06:49 64.673 -17.465 3.8 km 4.2 99.0 4.7 km NE of Bárðarbunga
and 7 M3.0 – 3.9
Source IMO
There’s some lava fountaining happening from time to time on Mila 2
Eerie blue on Mila 2, but still burning and shooting up with lava lights rippling almost all the way to the left.
nice clear view of the eruption today

I think it interesting that what I assume is the “graben” has no snow on it
Clever observation Colin!
It’s the graben yes, the one that is 1km wide.
I saw it when I was there.
And yes, not much snow on it. Could be either optical illusion, due to snow and topography effects, OR geothermal heat from magma very near surface, that doesn’t let snow accumulate.
I wouldn’t expect less than a warm bedrock when such bedrock just slided downwards by dozens of meters overnight on a day on September. But I don’t think it must erupt.
clearer now, I think melt water the lava does not seem to have changed position in this view
Biggie coming in Friday 14.11.2014 11:25:46 64.610 -17.400 1.1 km 5.3 50.5 7.0 km ESE of Bárðarbunga
First 5+ for a while.
Yip, makes up for a lot of M4’s (1 so far today).
And quite a bit south of the other quakes yesterday and today. But it doesn’t look quite far enough for south-side of caldera? Might not have the position quite right yet. My guess is this is the big south side caldera quake people were predicting yesterday in response to all the north side activity.
I see what you mean. Given that IMO’s reference point appears to be on the north-west rim, 2.6 km south-east would put that quake closer to the north than the south.
It is in the south, the big red dot.
That doesn’t look to be south-east, does it. And I would have thought 2.6 km would be much further in.
You are right, it was changed to 5.5 km 🙂
Yes, I’ve just noticed that too. I’ve also noticed that they’ve downgraded an M3+ from yesterday to an M2.8 and an M3.7 earlier this morning to an M3.0. The M3.1 at 19.2 km depth is still there though.
I also noticed that of the eleven M≥3 quakes prior to the M5.4, nine of them were between 7.2 km and 9.6 km depths (2 x 7.2 km; 1 x 8.3 km; 1 x 8.5 km; 2 x 8.7 km; 1 x 8.8 km; 1 x 9.0 km; 1 x 9.6 km). Given that deep swarm of proceeding quakes, I was really surprised to see that the M5.4 was at a mere 2.6 km depth! Mind you, the preceding 27 quakes had all been in the north-east quadrant. There hadn’t been a quake in the south since 11:31 yesterday.
OT (except for GPS relevance) – I am waiting for a parcel being delivered by DPD in about an hour. According to their new “track my parcel” facility, their van, their driver (poor Nick!) and my parcel are currently in the North Sea a few miles off the coast of Denmark…
Dear me! I hope Nick has an amphibian-style van that is fully water-proofed! When he finally arrives, you must ask him how he got on. 🙂
Well, he’s on dry land now, 40km south of Hamburg, so about 300 miles east of where he’s supposed to be…
This is one well-traveled package! 😀
And it’s come – perhaps DPD have invented teleportation and kept it quiet (gives them an edge over the competition!)
Maybe Nick hitched a ride with The Doctor! 😀
Pah! Nothing! Last year I sent a package from the UK to New Hampshire, in the USA. New England, NE corner, right? US Postal Service sent it via San Francisco…a 6000 mile round trip. (plus 3000+ across the pond before that)
Perhaps he has a gps jammer so nobody knows where he is?
I refreshed the screen just after I took the parcel in and there he was, in my street – definitely teleportation ( or trailing zeros).
Some legacy IT systems do this when they “fill out” spaces to the right of Lat and Long co-ordinates with zeroes. It can throw the actual location out by hundreds of miles.
Yep, here we go, will this settle things down like it has in the past? Place your bets ladies and gents 🙂
5.4 quake in the SE of the caldera
Probably. Everything seems to have settled right down now. We’ll have to wait a while to see if the Bardy GPS really is recording a drop as it appears to be. ICE3 infrasound went right off the scale earlier today but that seems to be settling now too.
To m it appears this is a structural failure and it is following a pattern as DT says, action vs reaction. It has repeated many times now.
Wish I knew what the actual structure looks like but it seems the structure in the north collapses much easier than the south, so it bend, bends bends…… and puts pressure on the south side until it breaks and catches up.
Thing is, it is taking more and more buildup until it breaks so the difference in rate of sink on the north and south side is becoming greater maybe??
if this is indeed a pattern this plot should drop back down and slowly start to ramp up again over time
or
I could be completely wrong…I did see an image of Elvis in my grilled cheese sandwich yesterday 🙂
The dike seems to be acting up again this morning.
Maybe there’s a fresh injection of magma heading for Holuhraun.
That’s what I was thinking.
Maybe the rift is going to unzip back towards Bardar?
I don’t know but I don’t think it will… only because the fissure is fairly deep there I believe. Nevertheless, that is still one of IMO’s possible scenarios so can’t rule it out. 🙂
I wouldn’t say that the north is collapsing per se; cracking and shifting but no sign of actual collapse yet.
It’s curious this relationship between north and south. Why would the stress/strain caused by a swarm of quakes of median depth ~8km in the north-east be relieved by a single quake in the south-east at 2.6 km depth? Yet that seems to be the case.
I had ham, pineapple and cheese toasties yesterday but no faces in the cheese. I feel deprived now. 😦
The connection works both ways. Every time there is a large earthquake activity in the south, the activity in the north drops for one to a few days. So whatever moves in the south releases tension in the north.
Aha! So what appears to be the case actually is the case this time! Thanks for that Albert – and may I say it is good to see you! 🙂 I’ve missed you these past few days.
Any guesses to what the mechanism is?
This M5.4 was only 2.6 km deep – could that be around the bung?
It’s a strange world, when the reaction to a big earthquake, in a big volcano, that is already having a big eruption, is a big sigh of relief 🙂
What I would like to know is how one quake has this affect on the system!
Essentially it has been shut down like someone flipped a switch, it went from crazy to fast asleep, why does this happen?
IanF, could it be as this?
B. with a plug shaped as the orange.
Pressure building up by moving Hreppar plate to north, stress derives, quakes in the north occur. Because of the shape (less resistance north), the north side tends to sink more faster than the south side (sinking plug in blue).
Stress in the south is building up by the oneven position of the plug. The subsiding south compensates in one strike, a new balance has established.
It takes some time to build up pressure for new stress, is building up, etc.
Yep, I can see this as a definite possibility
Or an indefinite possibility, either one works.
😀 there is always a Smarta$$ in the bunch
Here is my definite possibility of a theory guesswork
There is a pressure buildup on the BB side of the feed to the fissure and it causes the quakes in the north side “roof” of the chamber.
The M5.4 is the “sound” of the magma leaving and thus relieving the pressure in the chamber
Not quite fast asleep – immediately after the 5.4 quake there were about twently little quakes along the fissure near Kistufell – then it went back to a few more little quakes along the north side of the caldera.
It would be interesting to know if the same sort of thing happened after every 5+ in the SE.
I haven’t kept any data on quakes ❤ but I can tell you that after the last mag 5+ in the south (an M5.2 in the ESE at 7.6 km depth), it was 9 hours before there was another quake over mag 3!
LOL Oh I just realized that typing “less than 3” using the < sign before the 3 would automatically produce a heart! 😀
Or an upside down portion of the Average White Band Logo.
Oh BB is snoozing, you can see it here
You can see it everywhere! The tremor plots, the infrasound array, the drumplots. It’s like that M5.4 was one huge burp that relieved the gassy build-up in his tummy. 😀
Ok, forgive me all but I just gotta try it! ❤
Yep! It works! 😀
Yay, it works! Must note that one down it is so cool! 8)
Bother! 😎
That also happened after the M5.4 on nov 6th. It took almost 9 hrs to produce the two 4+’s.
I looked to see if there was a relationship between M5 quakes in the south and an increase in the fissure quakes but could find nothing
Thanks – today must be a one-off then.
No expert but what may happen is all the noise in BB masks the small deep quakes in the surrounding area and when BB gets quiet, the system picks them up???
BB is flatline right now!
Ever since I saw that plate animation I keep thinking of the Hreppar Microplate as an icebreaker like this:
Bill, just out of curiosity, why dismiss what the experts say about the GPS readings?
Asked this above, but probably lost in the flow … Mopshell, I don’t recall seeing what IMO-types say about the GPS readings. Can you (or someone else) enlighten me? I’d love to know.
Here’s what the IMO had to say in a RUV report on the 4th of September. http://www.ruv.is/frett/up-to-130-meter-high-lava-fountains There are numerous comments like this regarding the GPS readings. Not one of them mentions the movement of tectonic plates! This is when I first understood what their real use in the field was!
Mopshell, I may be incredibly off base, but I think the magma/ dyke measurements would only use a few of the GPS stations. Also, if the dyke is at or near the plate boundaries, then dyke expansion (as also reflected in magma volume) indicates tectonic movements. … I don’t see a conflict.
The GPS devices at VONC,GFUM, DYNC and HAFS are permanent stations and part of a network used to track movements of tectonic plates.
IMO has little said about the GPS movements (big picture) because they have not yet formed public opinion on what they mean and individual indoors do not agree.
( Not that I know what they mean, I just have a theory )
Please don’t confuse what I comment as coming from someone who actually knows something about what we are collectively witnessing. I’m just making observations. In this case, the very well done animation showed to me that the Hreppar Plate was rising up and almost pushing the bung down, much like this ice breaker does. Maybe that has something to do with the pattern that DT and Ian have been showing us, the cause of which seems to have not been fully explained. Thanks for the thoughts, Mopsey.
Regarding GPS, I spent a significant part of my career developing position-measuring equipment, much of the time trying to make it more accurate. I am blown away at how far it has all come and thrilled to see all this data and interpretations of it in volcanism, which is all new to me. As I understand it though, there are three main causes for lat/long changes in the GPS: magma-related inflation-deflation, plate tectonics and measurement errors. Unfortunately they are all related so it’s difficult to get a consensus on what they mean. Irpsit seems to have a pretty good handle on interpreting it.
I especially enjoyed the discussion about the gunshooter, et. al.
Friday Night Riddles are up!
Wonderful article !
I’m only back for a moment.
you could have made two of them
I really fell in love with the dragons’ teeth (were are my marbles?)
New topic is up!
https://volcanocafe.wordpress.com/2014/10/21/mineralisation-processes/On behalf of the imbecilles at WordPress, I apologise for the fact that they appointed a crossbreed between a sea slug and a tapeworm to write their software.
As you will by now have noticed, WP has assigned the date it was placed as a draft as the date published which means comments are closed. Furthermore, there seems to be no way to change this date other than deleting the topic, rewriting it.Thank you WordPress, way to go…
Copy it into the new template and press “execute”?
That’s rather rigid …. 😀
Glad I got to read your wonderful article before it went away. How frustrating for you. Said some bad words for you, out of print. 😒
I was able to read it by following the mail link. Great stuff. I almost flunked geology in college ’cause I was to busy not going to class. Now I can see I missed a lot.
Help! I am receiving signals indicating that I might have gone off the deep end, information that is of the highest importance to myself (but no one else).
I found and read an article by pyrite on mineralization and wanted to thank him for it (all the articles here are of excellent quality and produced with great care and professionalism). The first signal was the recognition that I was unable to leave a reply. Then the article as a whole vanished so it might have been a figment of my imagination except that it exceeds my imagination by a considerable margin.
Naw, Pyrite was in a mud wrestling contest with WP over the mineralization post that WP is mostly ahead on points as of this writing. It will be up eventually. Cheers –
OT: @ Ref http://www.igepn.edu.ec update on Chiles-Cerro Negro.
Fi-nal-ly!!!
Sorry for the delay, but in the end I had to trash the post and redo it. Hopefully it works now, apologies!
https://volcanocafe.wordpress.com/2014/11/14/mineralisation-processes-2/
Below is the WordPress employee responsible for the development of software sneaking away as I make my views on the matter very clear to his bosses. They are not amused either, as you may be able to tell…
Is that a drawing by Uderzo or what his name by any chance? (The one with Asterix & Obelix)?
A sort of relative, Belgian cartoonist André Franquin whereas Asterix was Goscinny & Uderzo IIRC. Gaston was an offshoot of the Fantasio/Spirou-series. 🙂
http://en.wikipedia.org/wiki/Andr%C3%A9_Franquin
Tiens, je comprend ce qui est écrit 😀 lollllllllllll
Rogntudjuu? 🙂
There was also “Capitaine Haddock” from Tintin who was also famous for his colourful vocabulary, but Hergé could not use any swear words as he knew his audience included children. He sanitized it in a very humourous way, but the message was coming across nevertheless.
As a result, Captain Haddock’s colourful insults began to include “jellyfish”, “troglodyte” and “ectoplasm”, “bashi-bazouk”, “visigoths”, “kleptomaniac”, “sea gherkin”, “anacoluthon”, “pockmark”, “nincompoop”, “abominable snowman”, “nitwits”, “scoundrels”, “steam rollers”, “parasites”, “vegetarians”, “floundering oath”, “carpet seller”, “blundering Bazookas”, “Popinjay”, “bragger”, “pinheads”, “miserable slugs”, “ectomorph”, “maniacs”, “pickled herring”; “freshwater swabs”, “miserable molecule of mildew”, and “Fuzzy Wuzzy”, but again, nothing actually considered a swear word.
In addition to his many insults, the most famous of Haddock’s expressions relate to any of a number of permutations of two phrases: “Billions of bilious blue blistering barnacles!” (“Mille millions de mille milliards de mille sabords!”) and “Ten thousand thundering typhoons!” (“Tonnerre de Brest!”).
(From Wikipedia:)