Don’t shoot it Martha, it’s bigger than both of us!!
 “Do like the gallant Roman soldier who, at the destruction of Pompeii, died in his sentry box. Remain at your post. When the critical moment approaches you may — to cheer yourself up — sing ‘Let me like a soldier fall.”
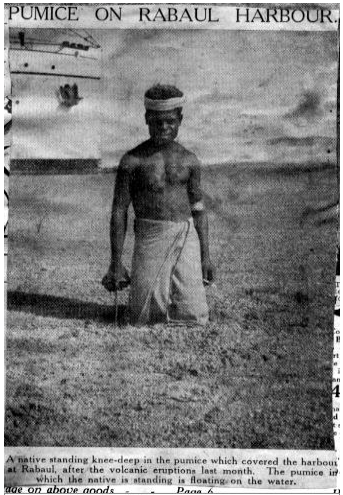
Well, talk about futile last commands. This order was apparently given to soldiers prior to the 1937 eruption of Rabaul. Perhaps we should add human imbecility to the list of volcanic hazards in addition to gas and ash fallout.
(picture and quote taken from http://press.anu.edu.au/wpcontent/uploads/2013/12/ch063.pdf
Note that the vent shown in the following video is Tavurvur which
is the small steaming cone in the left of the picture from 1937.)
Recently we have talked a lot about explosive volcanism in association with Bardarbunga. Here is a great example of what an explosive eruption can look like, albeit a very small one as far as volcanoes go (warning, earplugs recommended):
Rabaul Caldera
To say Tavurvur sprang back into life on August 29 would be a gigantic misrepresentation of the facts. Not only was the eruption not really what you would describe as a jaunty pas-de-chat across Blanche Bay but Tavurvur has also been merrily erupting away almost continuously since 1994 and actually started long before that.

In fact Tavurvur is just one satellite cone of the Rabaul caldera complex and a small and young one at that. According to Nairn et al. “Geology and Eruptive History of the Rabaul Caldera Area, Papua New Guinea”, volcanism at Rabaul goes back to at least 0.5 Ma. There have been multiple pumice forming eruptions and caldera collapses probably accompanied many of the larger eruptions. Last century there were two eruptions that nobody here would hesitate to describe as major eruptions: 1937 and 1994. Both of these destroyed the town and resulted in loss of life (507 in 1937 (Wikipedia) and there were four fatalities in 1994 although the town had been evacuated beforehand). However, as is so often in the scheme of things, what for us is major, is just trifling for nature. It is thought that eruptions the size of 1937 and 1994 occur every 30 to 60 years, in other words, just daily business as usual for Rabaul. The last caldera forming eruption, on the other hand, was 1400 years BP with another one occurring about 7000 years ago and the larger Kulau Ignimbrite 20,000 years ago. Needless to say there have been many more large pyroclastic eruptions in between though not large enough to lead to caldera collapse. No wonder then, that Rabaul qualifies as one of the Decade Volancoes (see Henrik’s great post on these: https://volcanocafe.wordpress.com/2012/12/25/the-decade-volcano-programme/

Rabaul, however, is just one of four large calderas located on the Gazelle Peninsula, the northeastern tip of New Britain. Obviously the tectonic setting, like elsewhere in New Britain, is very conducive to caldera volcanism. One look at the maps shows us why. To the south of New Britain the Solomon Sea Plate is subducting steeply under the South Bismarck Plate (there is actually a spreading center in the Woodlark basin – slab push / slab pull?? you choose). This subducting margin is the main source of the island arc volcanism that lines the northern coast of New Britain.

tectonic map: http://volcano.oregonstate.edu/vwdocs/volc_images/southeast_asia/papua_new_guinea/PNG1.jpg
However, directly to the east of Rabaul, the North Bismarck Plate is sliding up and around the South Bismarck Plate in response to the wider collision of the Pacific Plate and the Australian plate. Here we see strike-slip earthquakes and extensional faulting. This suggests that there is a fairly abrupt eastern edge to the Solomon Sea Plate as it subducts under the South Bismarck Plate, almost reminiscent of a slab window or tear. In other settings, such tears are conducive to pooling of volatiles and melt and it is precisely along this margin that we find the North/South lineament of the four major volcanic centers on the Gazelle peninsula. On top of this slab tear/margin scenario I suspect that the line of four calderas indicate one of those extensional settings in the above map (i.e. the little white rectangles where the plates are moving away from each other). Acocella and Spinks did some work on this kind of thing in New Zealand and came to the conclusion that shear (the strike-slip faults) forms a constraint on large shallow magma bodies forming whereas extension facilitates it. Given this setting, the prevalence of caldera volcanism on the Gazelle peninsula makes more sense and extension provides a good explanation of the slightly NE trend to the lineament that stands about 60° off the line of the volcanic arc elsewhere on New Britain. Well it was a nice theory. Unfortunately the local geography skewers the idea. There is indeed a local extensional graben but it is aligned NNW, not NNE and it is about 20 km west of Rabaul. Drat. Guess I have to go back to the drawing board on that one.

Moving on to the form of volcanism at Rabaul, we see it generally takes two forms. The first is regular basaltic and andesitic eruptions of lava and scoria that build up nice symmetrical cones and shower more distal areas with ash. Over time such eruptions can have a major impact on the local environment. The larger eruptions involve uplift of the caldera floor, which strands local fish, and the ash buries buses in ash, destroys local towns and creates great backdrops for soliders to take photos to send back home. That kind of thing. The second form of volcanic activity is more intermittent explosive eruption of dacite and, more rarely, rhyolite. These eruptions dump large quantities of pumice and coat the surrounding countryside with ignimbrite and plinian fall deposits. Only the largest of these lead to caldera collapse. It is this type of explosive eruption that Nairn was referring to when he said there have been at least five and possibly as many as nine ignimbrite forming eruptions over the last 20,000 years. These eruptions can be pretty violent. Walker also had a look at Rabaul and came to the conclusion that the Rabaul ignimbrite was deposited by “very high velocity pyroclastic flows” which devastated the surrounding area out to at least 50 km from source.”
But, as stated above, ignimbrite forming eruptions are only the top end of the scale at Rabaul. To quote Nairn again, “At least fifteen smaller dacitic pryroclastic eruiptions occurred during the interval between 20ka [i.e. the major Kulau ignimbrite eruption] and 1400 yr B.P. [i.e. the Rabaul ignimbrite].” Ok, adding in the ignimbrite eruptions, that is about one major eruption every thousand years. Not that dramatic considering how short our lives are. However, seven of these occurred in the last 5600 years of that period, culminating in the Rabaul ignimbrite. The Rabaul ignimbrite was the largest and most energetic eruption since the Kulau ignimbrite.

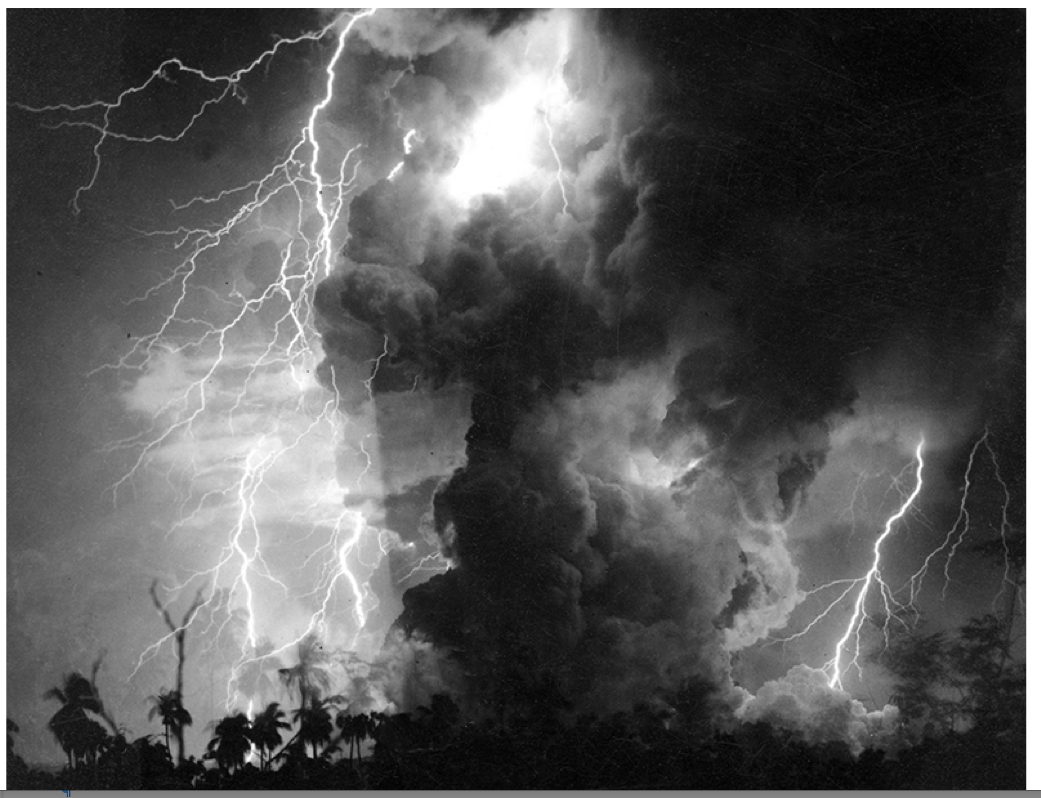
Subsequently, there were no notable dacitic eruptions until 1937. However, recent uplift (more than 1 meter was measured between 1973 and 1981 prior to the 1994 eruption) and the short interval between 1937 and 1994 indicate the reservoir is once again charged. That implies the system required roughly 1400 years to produce a significant quantity of dacite to induce two eruptions over a space of 50 years. That is pretty rapid recharge and I think it is safe to assume this is just the beginning of a new series. So watch this space! While Bardarbunga is still working out what it wants to do, it pays to bear in mind the world is studded with volcanoes, many of which are quite restless and can pose a much higher risk than Bardarbunga. While researching this article I came upon this gem from the 1937 eruption. It is the earliest photo that I have seen of volcanic lightning. And what a beauty it is!
Addendum: Similkimeen found an absolute classic of Duk Duk dancers dressed up like volcanoes that just has to be up there with the best volcano / cultural photos out there.

And MikeD found this wonderful book on the region:
http://press.anu.edu.au/apps/bookworm/view/Fire+Mountains+of+the+Islands/10911/ch03.xhtml
References: This article draws heavily on my layman’s reading of Geology and Eruptive History of the Rabaul Caldera Area, Papua New Guinea released by Nairn, McKee, Talai and Wood in 1995.Any mistakes or misrepresentations are entirely mine. I highly recommend reading the original to get a better idea. The other major source was a wonderful historical document from Australian National University: Calderas, Ignimbrites and the 1937 Eruption at Rabaul: 1914–1940 to be found at http://press.anu.edu.au/wp-content/uploads/2013/12/ch063.pdf This is a great historical impression of the eruption in 1937, comparable to that one from Taal someone posted a couple of years back. There is also a wonderful thesis out there if you can find it from Herman Patia at the Australian National University. Chris Newhall (yes that Chris Newhall) did a short précis on it too: http://www.geo.mtu.edu/volcanoes/rabaul/rabaul.usgs.html And finally anything with Chris McKee’s name on it is worth its weight in gold as he is at, as I understand it, the Rabaul Volcano Observatory. Bruce Stout Friday Riddles are up! This set has a chemistry theme! Click the tab at the top of the page.


One small quake of 1 mag just crept onto the screen now. 17:39, exactly 3 hours after the last quake noted.
And I just get home and the Mila cams, both of the, are working for me at last.
Celebrations tonight!
*cheers*!
Yes the mila cable to North Yorkshire has been repaired too!
And a drink on me Islander. Don’t let the dragons know though as the bar isn’t open officially until Friday, 😉 By that way I absolutely love your photo above. Can I have permission to put it on my desktop background? Please!!! Pleading wid ya now! Or is it copyrighted? I suppose it must be. 😦
… you mean it’s not still Friday? oops.
We have this Swedish expression – forgiveness is easier to obtain than permission. 😉
Same expression in UK!
“Att få förlåtelse är enklare än tillåtelse.” Maybe, but not as poetic. Especially not on the lips of a Yorkshire lad/lass! 😀
LCCC rulz, ok! Even when YCCC lift the throphy and Lancs are relegated. 😉
yes, Frances, your permission is shure
*(private and do not let Dragons know ;-)*
Thanks Islander. 😀
You are welcome
*cheers*
Did you ‘vote’ for Islander’s beautiful photo by visiting and viewing it directly at http://www.airliners.net/ ? I think that should be a condition for personal use of the photo on your desktop… 🙂
I understood knowing the icelandic EvE online players that the bar opens friday – friday? – friday – friday – friday etc 😀
Oh by the way, i’m an EVE Online player to 🙂
I have been that since 2004.
me too they had soem attacks so i pasted on their facebook i thought it was Bárðarbunga and should make a new ship called barda hehe 😀 i am TottyRose in game 🙂
Big one coming thru on drumplots………..I daren’t play “Guess the mag”
IMO still doesn’t show it. I’ve spent a fair bit of time trying to figure out EMSC and USGS sites and still can’t get what I want—a list of incoming for Iceland.
Yes I am surprised about the wait for this one. Not as large as the last but the last quake shown is a 1.7 and it definitely isn’t that one as it is definitely much ,much bigger than that. Odd really they haven’t shown it yet as they have been so quick on other ones today.
4,6… Took abit but there it is
That 18:45 quake has finally been listed:
Monday 22.09.2014 18:45:46 64.671 -17.479 7.3 km 4.6 99.0 4.2 km NE of Bárðarbunga
It might lessen your frustration level to remind yourself that there are real human beings, people, at IMO working very hard behind the scenes to obtain data as quickly as possible. And _their_ reasons for wanting this data are, dare I say, much more important than our idle curiosity. Trust that they will report data when it becomes known and accurate. They want it quickly for urgent reasons. How do you feel when you’ve worked frantically at a project, only to hear your boss say, “So you finally got that done, eh?” 🙂
Maybe some people get frustrated, but not me—-at no point. Please don’t interpret any of my comments that way! I am too much aware of the ongoing strenuous efforts of people at IMO and beyond, and of the many difficulties they face including not breaking one’s ankle or getting gassed, maintaining vehicles, instruments and datalinks, hardware/software issues, data wrangling, and communicating with politicians and others who are anxious to know what to do about the situation. I am just grateful that I can see so much imagery and data and read so much about it all. And chat with you all! And respectful of Icelanders’ pragmatic and intelligent approach to all this. However, I must say that when my internet connection looked like it was down last evening, I was really wondering how I would survive if the outage lasted long! 😉
Respect
I am sure they need a meal break too, and a toilet break, and if they are like the English and unable to smoke indoors then also a cigarette break for some. As you say, they are humans, BUT… how much better than instruments!
Waveform picking takes a lot of experience to get correct. A seismologist has to look at a squiggly line and determine which wiggle equates to what ray path. It’s a lot more than just P and S waves. You have waves bouncing off of the Moho, waves that go as deep as the core, and waves that bounce off of any discontinuity existing in the region. These picks are then run against the existing travel times that are known for the terrain. When the waveform picks for one station do not agree with the model, and other station data, it has to be resolved so that an accurate determination can be made about what caused the discrepancy. And which solution is accurate.
I’d say they are doing a damned fine job. Especially when you consider that the ground in Iceland is far from homogeneous. It has millions of years of lava flows inter-bedded with layers of tephra and erosional deposits… each with their own velocity indexes, each making its own contribution to the delay time of a particular wiggle in the trace… and possibly contributing to multipath effects.
Thanks for info on some of what is involved in verification. . . . I will in future try to avoid using the word “finally” on this blog, as too much is read into it. I was referring to time lapse only, not to my emotional state or any judgement.
Hope the people at IMO are pacing themselves – this could go on a while yet. And also that the scientists in the field are taking good care of themselves too.
To give you an example… here are the ray paths for some of the principle phases from a quake.
From “Seismic Traveltime Tables” B.L.N. Kennett
IMO doesn’t have to deal with most of them seeing as they are so close to the source… but multipath effects of waves diffracting and reflecting around in the crust of Iceland can play havoc in trying to figure out what you are looking at.
Iasp91 and AK135 are two of the more common Earthcrust models that traveltime tables are built from. They are quite often subject to change and revision.
If you wish to play the home game, here is AK135 Travel Time Tables Developed by B.L.N. Kennett Version 1997
In the image and in the actual tables, the degree nomenclature is the surface angle of the seismo from the quake source. (geological angle)
Wow, thanks for all that info on reading the seismographs GeoLurking, I hadn’t realised quite how much was involved! I must do some reading up on that obviously. I am learning so much on here but my poor memory makes it hard to remember. I sometimes think I have a colander rather than a brain nowadays.
I dug through a text on phase picking back during the El Hierro thing and came away with a profound appreciation for the sheer amount of work that goes into puzzling out what those waveforms say. I didn’t gain any real skill, but the perspective change was quite radical.
Perhaps the day shift has gone home and there are fewer people on the night shift?
I’m usually on the night shift, being 7 hours behind Iceland, but I’m working in the yard today. Also, I need to spend less time sitting at the computer because it’s making me back sore!
Get a better, more ergonomic chair? 😀
this one is supposed to be ergonomic. I need a new back.
Ooooh, you have my sympathy. Backache is just awful.
slows me down for sure
I’ve noticed over the past 3 nights that there are many hours when there appear to be no EQs, but by the time I wake up (I am in the U.S.) there are EQs when there had been none. I very strongly suspect that IMO decided to let people go home and get some real sleep — and on a regular basis.
Following are some converted TIFF’s uploaded earlier today to a secondary IMO server. Circa 1997.
Folder was called Gudrun Larsen, or something said that so i am assuming he took the pictures.
1997_05_09 IMG13 Grimsvotn Bardarbunga – Gudrun Larsen

1997_05_09 IMG16 Bardarbunga gjalp – Gudrun Larsen

1997_05_09 IMG11 Bardarbunga – Gudrun Larsen

she actually, Guðrún Larsen is her name, quite Icelandic tho…
excuses 🙂 and thanks 🙂
Just checking in. Bard1 looks like I’m looking out a cave. 🙂 Glad plume has went above instead of blocking the view. Doesn’t look like fissure is putting out as much as it was last night.
Bard 2, very interesting, lot of lava. I just saw a little plane fly by and then back again.
I’m trying to think about the confusing gps plots
lets take all the gps stations and draw triangles to join them together – if those triangles were wedges of soft cheese (say) what would happen?
lets take vonc gfum hafs and take my imagined wedge of cheese and try to move the corners from where they started to where the exaggerated arrows end up
I end up almost turning the slab of cheese over – and I’m imagining vonc goes up while the others go underneath
so then looking at any of fjok skro or hauc along with those I still get the turning over from vonc and hafs – but the cheese gets stretched and I think one of the edges would probably rip
now obviously all these motions are super exagerated as the arrows show km long lines for mm long changes, but I guess the stretched cheese images show where things would get to if everything kept going in the same direction for one million times as long – and thus the increase/decrease in tension in that area???
so given that my imaginary cheese is flipping over – do we see vonc rising and gfum sinking too (or vice versa would work in cheese too)? or is that just motion just squashing the cheese rather than rotating the entire triangle to get the movement?
I’d like a 3D animated model of the GPS station movements over long timeframe and then compare that with the accelerated recent movements – if someone is feeling like plotting them – I don’t have the skills but I think it’s the only way I’m every really going to get my head around which way those GPS stations are actually moving long term 🙂
I do like a nice bit of wenslydale, Gromit, with crackers of course 😉
LOL My granddaughter liked your remark. 😀
I’ve just tried it for real and got cheese in my keyboard………….
I had cheese coming out my nose, there… So yes, there’s at least two of us with cheese in the keyboard now.
Oh please don’t use cheese to illustrate it! My mouth is now watering, my thoughts are in the fridge, my stomach is rumbling….. and I am on a diet! 😦 😦
And after the replies I am also thinking of nachos and crackers too. 😦 Oh woe is me.
Sorry Frances, umm the cheese is going green, it’s off, and stinkin’ – does that help explain the ‘volcanic’ gasses ??
It does indeed. It also stops me wanting cheese so thanks. 😀
I’ve been ruminating since my last post on the GPS movement. How about a lever action? If the rift north of Bardarbunga is moving at a faster speed than to the south (so that relative to the north, the south is stationary, even though it is probably also moving, just at a slower speed perhaps), then if the plates act like two rods, pivoting, the southern end could start pushing VONC, GFUM and HAFS (not so sure about the mechanics of this one) towards Bardarbunga.Either that or there is pressure buiding in three separate volcanoes, Grimsvotn, Tungnafjellsjokull and Hamarinn and in fact, all three stations are also showing some uplift, although Hamarinn and possibly Grimsvotn could be variation, so it is a wait and see, to detect trends.
I have to admit (**sigh**) that I made the mistake of thinking the GPS movements were just indicative of plate movement – so the arrows pointing in all directions was just a mass confusion for me – until it finally dawned on my bludgeoned brain (so much new information incoming!) that the IMO and IES were using the GPS data to get a handle on where and what the magma was doing! That gave me a whole new perspective and suddenly all the arrows made sense – at last!
If you isolate GFUM, HAFS and VONC and see them as relating either to their own inflation – or deflation of Bárðarbunga (I’m not sure which it is but it may be both); then see the others on either side of the dike intrusion – GSIG, THOC, HRIC, URHC etc – as indicative of the inflation in the dike, then the arrows make perfect sense and you can see why the IMO, IES and Haraldur Sigurðsson are all saying that more magma is entering the dike than is leaving it via the Holuhraun eruption. It also explains the ‘swinging’ motion from some stations – they were following the progress of the dike.
hmmm, thanks, I will have to ponder this. I have also been looking at it as indicating plate movements.
Uh huh – I think this is because of past conditioning regarding GPS, the use of. In general parlance, we’ve only heard about it in relation to explaining plate movement but, in the far more specific and detailed field of volcanology, GPS can also be used to track localised movements other than tectonic plates – who knew?! 🙂
Not used to thinking of the ground squinching around. Though the last big quake we had here, I was standing on flat ground looking at a row of Lombardi poplars planted along the canal—those tall skinny trees. I could see the trees tilting to right and left as the wave went right along the row, most amazing.
Oh I would love to have seen that!
With only one exception, for every other earthquake I’ve ever experienced I’ve been in bed – I now have a fair idea what a vibrater bed feels like. 😀
OK, so I had time to look at the GPS plot for this whole series from that point of view. It could make sense to see it as showing local inflation at the dyke. But as far as GFUM, HAFS and VONC—-I can see their movement as indicating deflation of Bard, sort of ‘sucking them in’—-but would that really happen, especially Grims which is farther away? Also, I don’t see how the movement of those mountains could be read as showing their inflation—why would they go in one direction or another just because they are growing? Also, Carl recently pointed out that Vonasgard is undergoing deflation.
Aha, thank you for that! So it’s back to the drawing board for GFUM, HAFS and VONC! The others though really do appear to be representing what’s happening at the dike. It’s interesting, isn’t it! 🙂
dont use swiss its like having many caudrons erupt at once….luckily the cat ate it…
Sorry Edward to be distracted by the cheese metaphor….I’m sure I saw an animated GPS movement thingy a few days ago, no idea where (resists temptation to say it might have been in Wensleydale……)
cheese is good, I was imagining slightly warm medium cheddar, but each to their own, if you spot the animation link and can repost it that would be great.
i think i will go and make a nachos volcano with red chillies …be back momentarily
And two NASA Modis true color plume shots.
lots of dust on the lens/sensor
Space dust I presume
Yeah second image seems quite fuzzy.
Better get someone suited up to clean that lens XD
Spaceplanes is what is needed. Unmothballing the Shuttles is one option.
Please bring back Concorde, Blackbird and Phantom II. Like Cold War.
Wife when she was staying with friends in Marysville, Ca. Home of Beale AFB and the SR-71, was out in the back yard and this self-described “Hippie Chick from Elk River Oregon” saw this amazing shape
with “Blue Diamonds coming out the exhaust!!” “What was that Black Bird?” Her friend who had a son that was a Mechanic at Beale said: “Yes”….
Amazing aircraft. What was interesting that there was no autopilot or fly-by wire. The panel was all analog-very like the cockpit of a DC-7 of the period…
Pure, raw, aviation….
Forget Concorde! It used to make out house shake from the sonic boom as it went along the Channel to Paris. 😉 Mind you, SUCH a beautiful plane. ;D
The past is the future.
Warning : Prop & Jet Blast (*aka Aviation History 101*)

Yes, and predecessor of this all was the “Tin Donky”,
the J 1 (December 1915) forfather of Junkers J 13 (June 1919),
(F 13 only after July 1924, JL-6 / JL-12 in USA from 1919)
that pioneered all metal construction. No wood or fabric.
Not all know Boeing B-47 (December 1947)
and B-52 (April 1952) were “configural concepts”
already worked out by Junkers engineers as EF 132
(and aeronautical exerts in Germany)
http://en.wikipedia.org/wiki/Junkers_EF_132
before their surrender in 1945.
Anyone wonder why US was so quick build them after the war?
They got Germany´s technical data, so did the Soviets
but they were slower, mostly power plant wise.
But the Soviet (German) designed EF 150 was built.
Hell, Saturn V was Wernher von Braun’s wet dream. For him, the V-2 was a convenient research program.
Wernher Magnus Maximilian, Freiherr von Braun (March 23, 1912 – June 16, 1977) was a German and American aerospace engineer and space architect. *Wikipedia*

Fortunately he did join the other team.
My father was a precision engineer at Link Miles. He made lots of custom bits for Concorde. No wonder they were so expensive. But beautiful.
Hi Edward. The GPS movement seems consistent with inflation along the dyke northeast of Barbie, plus deflation at or near the caldera itself. The interesting part is that there is no indication of any rifting south/southwest of Barbie.
In my opinion this pretty much settles where the magma in the dyke comes from!
Thank you, Albert. It took me a long time to understand what the GPS was indicating and I’m grateful to you for confirming that new understanding. There’s a real sense of relief for me in that part of the volcanology jigsaw puzzle finally slotting into place. 🙂
Iceland Review Online has a short article out today, by Eygló Svala Arnarsdóttir, here is most of it:
“Professor of geophysics Magnús Tumi Guðmundsson told ruv.is this morning that as long as the Bárðarbunga caldera is not sinking faster than it has until now and the eruption in Holuhraun remains stable, the probability of a sub-glacial eruption will decrease.
“However, if the caldera starts dropping faster, or the eruption in Holuhraun subsides, then the magma will likely find another way to the surface, he reasoned.
“Volcanologist Ármann Höskuldsson told eyjan.is yesterday that he believes the current activity will lead to a sub-glacial eruption because there is much more magma underground than is currently being emitted at Holuhraun.
“The caldera subsidence also indicates a sub-glacial eruption, although it is impossible to predict when it would start, he added.
According to Magnús Tumi, it is unusual that an eruption remains stable for such a long time. The Holuhraun eruption has now lasted three weeks and one has to go all the way back to the 1963-1967 eruption which created Surtsey island to find a comparable eruption.”
All they really are saying is that “we are no longer in Kansas” – there is no precedent to fall back upon with this eruption. They have to cover their bases giving the most likely outcomes and have done so now for almost three weeks as there is no way to say that “Case R” is what will happen.
Yes, that is what it sounds like. Some people think authorities are supposed to know everything, but these people know enough to know that they don’t.
That is one of the best comments ever! Me like! 🙂
I am reminded of reading an interview with a professor retiring from our local university, who had won awards for the high quality of his teaching. He recounted that one time he told a class that medical science has no cures for a number of diseases. An undergraduate was very angry, completely outraged, and demanded to know WHY no cures had been found!
That is basic contents of sentance “we are not in Kansas anymore”.
Moreover I think (re Dike) it will widen more, and (possibly) snap into Askja.
I think they also do not field all possibilities, that is, escalation on current theme.
Larger. Scale now is but small Laki type. But we are in Laki type event.
And those reifted in episodes. Six or eight of them.
*not expert*
One thing worth mentioning is that if this IS a shield volcano forming with a direct mantle feed, this could in the very end be a very long, drawn out event.
Most of the large shield volcanoes in Iceland formed over a much longer period than the huge lava fields associated with the dead zone rift eruptions. Trolladynja formed over a period of 10-15 years, and Skjaldbreiður was fairly similar in eruptive rate and overall size. Gauging the current eruption rate at Holuhraun, this would approximately on par with the two aforementioned volcanoes IF it were to erupt as long as those two did. The problem is that it’s impossible to discern when this will or won’t fade away.
One interesting aspect of these large shields, is that they all have seemingly formed as a part of a larger volcanic system. Skjaldbreiður formed as a part of Prestahnukur. Trolladynja formed as a part of Bardarbunga. Kjalhraun shield volcano is a product of Langjokull central volcano. I wouldn’t doubt there are similar subglacial shield volcanoes as well that we don’t know much about.
I still think it’s more likely to see a shield event than a caldera collapse event.
If the current rate of 0.01 km3/day continues but slightly declines (we are currently at a total of 0.5 km3 estimated), this would result in a total of 1km3. Then by end of 2015, we would have reached 3km3 (the size of a common small shield volcano in Iceland). If it continues for 5-10 years (rather likely, judging by previous large rifting events and shield events), the eruption would then ammount to probably 10km3. A size that puts it in the same range of Trolladyngja or Skjaldbreidur.
But even a small 1-3km3 shield volcano eruption would be already HISTORICAL and UNIQUE.
In my opinion, the caldera subsistence needs to stop or slow down significantly in order to prevent a caldera eruption event. Down-sagging in the current manner causes further instability while also stretching the lid (tension). Rock is extremely strong in compression, but it breaks fairly easily when under tension – which is why Jon is presumably able to calculate a rough idea of when the lid may break (point of no return as it’s been said).
I don’t think it’s easy to even come up with a rough model for when a lid will break (45 meters or 1000 meters) but theoretically, the more the lid sags, the more unstable it inherently becomes.
If this were a piston style collapsing, I would be more inclined to think it could subside peacefully without breaking.
thanks! 🙂
I agree. No bluster, no huffing and puffing. Just an honest admission of “we don’t really know, but here are some possibilities.”
clap, clap!
“The Way Is Open” to the west, that elbow turn must still be pumped full to Kverfjoll.
The HOF has been looked at pretty closely the last 2 days, and the seismic there has been pretty noisy too, with what was thought to be all wind.
Now looks like the Gjalp is blocking the ring dyke formation, and the lead of the dyke is heading east on it’s merry go round route to the Tingussfjell intrusion dyke
Shallow radar science from the MRO mars orbiter.
http://www.planetary.org/blogs/guest-blogs/bill-dunford/delving-deep-at-mars.html
Talks about ice cap findings, and that no lithospheric depression under the northern cap
Found this on twitter – map of 3+ earthquakes round Bardabunga since 16th August. Looks like an IMO map but don’t know if they did the plotting.
Highest part of the glacier at the SW of the caldera and the GPS is on a line drawn between the 2 biggest clusters of quakes.
Everyone can make his/her own graphic.
This link is from the IMO-page: http://drifandi.vedur.is/skjalftavefsja/index2.html
Klick on “Sía” and find out for yourself. It’s in icelandic, but ok to understand.
Yeah, I think it would be A-OK if I could understand Icelandic! 😉 also if I could make my own graphics. A good project for the winter, maybe.
Has anyone noticed, or commented on the fact that this webpage for Bard caldera drop:-
http://hraun.vedur.is/ja/Bardarb/BARC/ – now has a graph showing the whole of the drop since the GPS was positioned? To see it just scroll further down.
Hadn’t noticed because I have been looking only at mirrors of that (vorklift and weerstation). Why does it show only 5 m subsidence since Sept. 14, when we hear that the GPS has registered much more?
Probably because they found already already 20m subsidence on an overflight before they positioned the GPS and I think it was perhaps at 22m when they got round to putting the instrumentation in, so it could now actually be at 27 m total subsidence.
Subsidience in the caldera is pretty much constant
16 Aug- 14 Sept, 20m subsidience in 28 days, average 71cm per day
14-22 Sept: 5m subsidience in 8 days, average 62cm per day
We might see a gradual slow-down of the subsidience rate. I will try to estimate when it stops.
third week Aug 78 cm /day
last week Aug 74 cm /day
first week Sept 70cm /day
second week week Sept 66cm /day
third week Sept 62cm /day, total cumulative 25 meters
last week Sept 58 cm /day, total cumulative 30 meters
weeks in Oct rate goes from 54 cm/day to 42cm/day, total cumulative 44 meters
weeks in Nov, rates goes from 38cm/day to 26cm/day, total cumulative 54 meters
weeks in Dec, rates goes from 22cm/day to 10cm/day, total cumulative 59 meters
weeks in Jan, rates slows to nearly zero, total cumulative subsidience 61 meters
At this gradually declining rate, assuming if does not change, we will reach 50 meters of subsidience in November but then subsidience stops sometime in January next year, at around a total cumulative of 60 meters.
Eruption would likely stop by then.
We now have 0.5 km3, and rate is around 0.3km3/month but declining. At this rate, we will get to 0.8-1 km3 by November, and the eruption will finalize at slightly more than 1km3.
Any idea how many metres it would need to drop before it became so unstable that BB could erupt? Would that likely happen before or after 60 metres or possibly not at all?
Depends on the sheer strength of the rock holding up the ice… and how much of a cavity is underneath it. Then you have to consider just how solid is that floor under the ice. Do the ring faults represent an existing weakness (yes) and what would it take to make them fail?
This might help (or not)
Click to access CHAP_03.PDF
5m is the subsidence they measured with the GPS. This is in line the graphs taht had a 3 day time span. The 20…25m subsidence that is mentioned is the drop relative to a measurement in 2011. They believe most of this subsidence happened since the event started this August.
(This “since 12 sept.”-graph is new to me. I like that they added it.)
thanks folks
The GPS is covering the beginning of Sep 12 to the beginning of Sep 23 – 11 full days in all – so a drop of 5m in that time averages out to a tick over 0.45m per day. Prior to the GPS being installed on Bárðarbunga, it was estimated that the drop was already at least 20.5 metres. Therefore, the GPS reading is an additional drop from that 20.5m starting point (Sep 11) and the current situation is 20.5m + 5m.
That is neat ,I notice the 72 hr is now at 0.9m,so still on an overall slowing trend.If it is an ice thaw drop ,maybe there is sufficient volume of melt water at the underside of the glacier to diffuse heat and slow the melting?
I really have my doubts about ice thaw being the cause of the drop. Perhaps some but never 27 metre depth of ice melted.
How many centimetres of ice would a 50C sub glacial lake melt per day?Lets say it started with a central area of heating on the floor,that may have caused initial hydrothermal activity and melted the ice fast for a start then gradually tapering off as melt water increases in depth?
Where do you pluck the 50c temperature from!
I just gave that temperature as an example,some active crater lakes get that high,but i guess under ice that would be unrealistic☺
Not that much. In some geothermal areas in Iceland where you can see thick ice, snow or small glacier, one can see that ice can stand well just a few meters above boiling water hot springs.
We can have the entire caldera of Bardarbunga boiling at 100ºC, and we wouldn’t see a difference in the ice cap above it, besides melting of a few meters, causing a small glacial flood. An eruption melts more, but it can still lurk hidden within a ice cave, and only resulting in a medium size glacial flood.
But wouldn’t it needs lava erupting to raise the temperature so high or not?
Didn’t quite mean erupting (I am tired) but meant close to the surface .
That longer term chart shows that 6 out of the 8 M5+ quakes were associated with a drop and not two, as was previously shown.
Here is a bit from Oregon State Uni. On Caldera collapse.
http://volcano.oregonstate.edu/calderacollapse
Note the crestal depression on the overpressure test with the resurgent dome?
From twitter/facebook Hugh Tuffen Lancaster univ.
Sampling lava with a shovel and cooking pot. It definitely seems to be much runnier than it was at the beginning of the eruption:
I agree about it being much runnier. I remember the early lava flow was almost like hot rocks tumbling forward and someone grabbing one on a shovel. Rockier and not so hot before.
I worried that the blade of the shovel would melt… 😮
Mila’s Bard 1 cam, 21:55 UTC

and Bard 2

Ok, dumb question alert. What determines how thick a lava flow will be when it erupts?
Chemical composition and temperature. Not sure of details, but I *think* if it has more silica it is thicker.
Just checked – the Holuhraun lava is basalt – low silica.
Viscosity, temperature and amount of dissolved gasses in the magma also play. Rate of eruption and slope of the volcano have a part. Here is a link to a Oregon State discussion between two different types of basalts coming out of Hawaiian volcanoes that may help a bit. Not much depth, but a start. Things get complex and wonderful in a hurry. A second link to a U Mass course on Vulcanology pdf. Cheers –
http://volcano.oregonstate.edu/book/export/html/131
Click to access Lava%20Flows.pdf
In addition to the temperature, viscosity and composition of the lava, the surface and slope of the surrounding terrain are also essential variables.
http://jardvis.hi.is/maeling_rummali_nyja_hraunsins
Mostly giggle:
The eruption of lava in the hole has been three weeks and continues with the same intensity as before. Field Group ies measured on Friday and Saturday thicknesses of lava in 12 formats ranging from craters that borders on Jökulsá. Taurus group assisted measurement of human from The National.
Borders lava are averaging 8 meter high on the north side with the most thickness of the center line of lava. Adherence to the center line of craters to the east-southeast of the edge of the Glacial River, the thickness of most second crater 30 meter, and 18-22 meter in most parts elsewhere. The average thickness is now currently believed to be 14 meters.
According to the map which Inga Jónsdóttir at JH has put together on the basis of the latest data, areas of lava about 37 km 2 on Saturday, volume is measured as the product of the thickness and area, and the result is about 0.5 km 3 . The uncertainty is at least 0.1 km 3 to or from.
Lava flow among these three weeks, according to this result, in the range 230-350 m 3 / s.
These figures are slightly higher than those that have been used so far as these have been careful to evaluate the thickness of the lava where the measurements had been filed.
The lava created by the largest that have been in Iceland for a long time. If examination of so far the last 150 years, only the lava that formed in the Hekla eruption in 1947-48 lobe, 0.8 km 3 , but that eruption lasted for 13 months. If the blowout erupted lava continues with the same intensity as before it could reach 0.8 km after two weeks.
I keep saying since a long time, even before the eruption at Holuhraun started:
– this is a major event, A major rifting event, that in that region it often takes form of shield volcanoes.
– so we are watching a new shield volcano being born in Iceland. For first time ever!
– it will probably grow to 1km3 by end of the year, and if it keeps for another year, then reaches 3km3, and then 10km3 if it would keep for several years.
– most likely eruption might decline over time, and it might stop sometime next year, at a total volume 1-3km3, making it a common small shield volcano eruption.
– such an eruption happens every 1000 years or so in Iceland. So it is a rather UNIQUE event.
Long lives Holudyngja
hip hip, hooray!
Long live Irpsitadynga! I’ll refuse to assume any other names except Irpsitabunga or Irpsitadynga! After all, you were the first to spot it!
As for the comparison made somwhere above between “caldera’s breathing” such as Campi Flegrei, Toba or similar, I can’t consider Bardy and the above mentioned to behave the same way: we don’t see more than 25 5M+ esrthquakes in either Campi, Toba or Yellowstone.
Something is breaking loose within Bardar’s edifice, something unparalleled to what we have seen in recent times.
We should consider (as many of us here do) that this should enact a total different play – but not talking about any doom and gloom bang – only another kind of subsidence unfamiliar to present day’s scientists.
Ultra small diamond chains from carbon donor. Form on decompression…
http://www.sciencedaily.com/releases/2014/09/140921145118.htm
Question:
When unerupted magma near the surface, particularly material related to an eruption event remains in either a dike or shallow magma chamber cools to the point that it solidifies, how does its volume change?
I appreciate that this is probably a many faceted question with a highly complex and/or qualified answer, but if you don’t ask, you don’t learn.
I am thinking specifically about this event and any molten material currently in either a dike of shallow chamber, and how its cooling might affect the pressure behind or below it.
Unlike Ice, magma tends to occupy less volume as it solidifies. In magma chambers, crystal formation can decrease the available volume of the “chamber” and cause an increase in pressure of the remaining melt.
That was my hunch. Not like water – it shrinks.
posted earlier in the thread by a dragon
http://www.ncbi.nlm.nih.gov/pmc/articles/PMC3783892/
The effects of the second factor, namely general solidification of the feeder-dyke, are well known. On solidification basaltic magma decreases its volume by about 10% (a factor of 0.1) or less, as is evident from comparing the typical densities of liquid and solid basalt4,5,6,7,8.
Thanks for the responses.
I asked because I was thinking about what might occur as the event calms down, and wondering, since there seems to be so much material either being erupted or in transit beneath the ground, if there is a significant change in volume it could either create pressure or suction, which may, of itself, have consequences. 10% of the volume of ..a very large amount.. seems likely to do just that. Although exactly what “just that may look like I cannot imagine.
But wouldn’t it play as a strong cement sticking the whole bunch even more tightly?
I wouldn’t know ! If it shrinks, then in the act of shrinking it may well pull in the sides of a chamber, or possibly suck further material inwards towards the contraction..
As I say,I can’t imagine it is an uncomplicated process.
Just looking at Mila cams 1&2 and that eruption tonight seems far more vigorous that I have seen it to date. Was it like that the past 2 days when I couldn’t see the cams?
Just my impression: yes, it’s been blazing away like this for the past day or two. There are past screenshots posted on the blog, that you could look back at.
Thanks similkimeen. I have been trying to get to bed a bit earlier lately as I have a medical condition that doesn’t do well with too many late nights so that is probably why I have missed any screenshots. It is the red hot lava flow that has really amazed me though. A few days ago when I could get the cams it was just a red line at the edge of the flow.
Now I really must get off to bed. Night all.
Likewise…health condition which these events are not helping…staying up for hours watching webcams when I can.. Not good for a narcoleptic !
I am also in that group of the medically conditioned but my GP and cardiologist are very canny people. Because I refuse to stress about my condition (takes too much negative energy and I just can’t be bothering with all that), my GP made a deal with me: she’d worry about my condition if I took my medication as prescribed. Seemed reasonable to me so I comply. However, now when I feel sleepy, I’m unable to fight it off as I used to. Instead, I fall asleep at my desk and (happily) wake up just before my head hits the keyboard. I then have just enough wakeful energy to turn off the computer and take myself upstairs to bed. I have long had the habit of reading in bed but that reading time has now been drastically reduced from about an hour to a minute or two (resulting in overdue notices from the local library at a rate heretofore undreamed of). There is only one conclusion to be drawn from this: my GP and cardiologist have conspired to ensure that I get the rest they consider necessary! 🙂
Bard2 a few minutes ago. Main Plume is very bright, with a noticeable yellow tinge within the right side of the fountain. Not sure if the yellow is real… it may be my old CRT monitor due to brightness/contrast..so thought I’d throw it up here for comment..

I have been noticing that brilliant yellow from time to time recently, on the Bard 2 shots. It shows up on some of the screenshots I have posted here. And my monitor is pretty new.
Sodium (NA) burns with a similar shade of yellow – how could Sodium be involved? Ocean origin?
I wonder how high the fountains are now? The one I’ve highlighted collapsed right after I took the snapshot, so I’m relatively sure it isn’t illuminated clouds.

Mila’s Bard1 at 00:06:22 UTC for the other nightshifters
and here it is http://snag.gy/TjJkV.jpg
it doesn’t display when I put any text on the same line as the URL, despite instructions to do just that

“New” lava flow (tounge) has run to north-east side of old lava,
nearer to “road” (track)
Visible on screen shots since 22:00 hrs at least.
I think eruption has intensified, in my opinion, yes
but had to tell. Its not abating like some opted for.
I never claimed that it abated. Just that when nothing seemed to be going on, coming to a stop is not out of the question for this sort of scenario and that it should not come as a surprise if it does.
I predict that it will actually come to a stop… at some time in the future. What happens between now and then is anybody’s guess.
Not You. One of IMO scenarios (No.1) that it will abate (run out eventally). True, but anyones guess is when. To December is one guess. But its also possible turn into full 1875 style (if entering Askja, I think).
Well, you know me. I am anti alarmist by nature. It fit my character. Sorry for miscueing.
As for Askja, that unlinkable paper showed that the ends of the fissure are where the stress fields are strongest. It could very well track all the way up there…. and there is also a quake swarm working its way towards Askja from the other side, (from the tuya with the cone on top).
If both of those represent a thinning, it could invoke a bit of melt formation out there under the rift from decompression.
I think this “new” lava flow on the north side of the “old” lava will eventually be the one that does for the Svarta
Just one more day, Colin, and you will be the one posting screen shots for the camless! 🙂
Hooray!
Eruption looking stronger now?
Looks that way. Lava flows are very active.
what’s going on here?

“Jiggling wire” is my first thought, but they all seem to have form to them and not really “noise” in shape. (The spacing seems just random enough to be real) If that’s the case, maybe “creaking” before something gives way.
How about a sub-sonic resonance from the fissure to explain the spikiness? Kinda like the worlds biggest flute. Or, maybe like a Whistling Pete? (except the frequency is REAL low comparatively). The fissure does appear more energetic at the moment.
http://www.youtube.com/watch?v=q9zFEUVkXCU
I recall some days ago Carl saying that he thought radar and other instrumental interference may show up on drumplots in the form of electrical pulses so I went looking for a comparison of seismic signatures and came up with the following which, I believe, confirms Carl’s prognosis with regard to the spikiness on the dyn drumplot:
Has anyone observed any lightning in the fissure plumes?
I have never seen any
Yes, there were lightning (4 Sept) several times at midday
(it was Thunderstorm abowe it)
I think there is some ball lightning at 2:09-2:11 in this video;
Now it looks like alot of lava spilling out of the side. Took this about 7:08 PM Mountain daylight time.

Tyler,
I agree. I have been looking at this exact zone for the last 2 hrs or so, and lava appears to be flowing (as compared to splashing or spraying) over the fissure rims. Earlier it was much more pronounced..but it’s changing by the second. There are times when you can see incandescent material falling and clouds rising from the same area…so I have a strong feeling the fountains are several 100’s of meters high..certainly as high as I can ever recall seeing them.
And the yellow tint is right there, unabated. What other substances besides sodium glow in this spectrum?
It’s currently the most exuberant I’ve yet seen. It looks as though the highest fountains are easily 3-4 times the height of the cone from the “flat” lava plain to the top. Just gushing out the front!
Looking at Bardy2 – it looks like seeing a bright light thru a gap in surrounding mountains.
Note the rim in front of the fissure…it’s clearly defined. Need to get a new measurement of the rim’s height for a better estimate of the fountain’s height.

Maybe “ridge” is better than “rim”.
The eruption is on steroids the past couple of days, It looks even more intense tonight than it did last night. Fun!
Large quake (I think) incoming. (It might not be. I’m still new to this. :))
Or not. Lol
Okay, definately not. What I saw was already mentioned a few comments up. My bad.
I’m beginning to think Barda cald is acting as an expansion tank for the fissure via a deep chamber. I am noticing a drop on the GPS , with out a big quake this time, that corresponds to the bump up of the fountain (tonight at least). Wasn’t the “rim” measured at about 100m the other day?
I saw a couple IMO images posted today and late yesterday that looked interesting. The first was the deformation as plotted by the aircraft posted by Bardarboom yesterday and taken on the 17th. The second was the graphic posted by Jane showing the magnitude 3+ earthquakes relative to the caldera. There is an interesting correlation between the quake locations and the deformation in the NE region:
Note, alignment was done with both plots using the eastern glacial borders matched to differing features in Google Earth. You can also see that the deformation does not correspond to the surface caldera topology in the earthquake graphic.
No expert here, quite a novice actually. I thought I noticed on one of the EQ 3D rotating plot (a least a week ago) that one portion of the “Plug” looked like it had a kink in it (sort of a slight “Z”). Wouldn’t at all suprise me that this is acting as a “hinge” of sorts altering the depression center.
It is not uncommon for caldera ring-faults to switch back and forth from normal to reverse configuration with depth, so what you observed is quite reasonable.
Bard 1 and 2, 2:46-2:47 UTC
Astronomy Picture of the Day (APOD) features a picture of the Holuhraun eruption:
http://apod.nasa.gov/apod/astropix.html
Heads up everyone…. the next article is in the que awaiting approval. I just read it. I think it’s very good! (I voted for release)
Looking forward to it! Really, VC is just a banquet of gorgeous pictures, interesting information and entertaining comments!
Mila’s Bard 1 & 2, looking spectacular at 4:40 and 4:44 UTC

http://geofon.gfz-potsdam.de/eqinfo/event.php?id=gfz2014sqni
5.1
http://www.emsc-csem.org/Earthquake/earthquake.php?id=401063
3.5 really, what’s up
usgs 5.1
http://earthquake.usgs.gov/earthquakes/eventpage/usb000sf5v#summary
Hello folks,
It has been a couple of hours since the last screen grabs, could we have some more please, if there is anything to see!
thank you Similkimeen
🙂
Do we get a photo from the North Sea?
IIRC, only one or two days more before you get full Internet access Colin? Hang on in there buddy! As you may have seen, access to land-based creatures is nowhere near 24/7 even if it can be such stunning views one would forego sleep if possible. 🙂
Hi_all._Drumplot…+5.0m??http://hraun.vedur.is/ja/drumplot/dyn.png
A big one just happened. 5.5?
USGS has it a little ways south of Bard, not in the caldera rim.
USGS initial location can be off quite a bit on this stuff.
I would be quite surprised if this was not on the caldera rim. As virtually every seismic event of this approximate has been on this rim so far.
Accidentally a word: “magnitude”.
Heh heh! ‘Proof read carefully in case you any words out.’ 😀
George, I haven’t found a high-resolution map of quakes, can you point me to one? Also I may not realize exactly where the caldera rim is.
With my incredibly non-existent expertise I am placing it around 5.2, based solely on my obsession and eye-shattering fixation on all instruments capable of providing data regarding this event for the last few weeks.
Well done, George!
Tuesday
23.9.14 _ _ 4:33:55 _ _ 64.683–17.418 _ _ 4.9 km _ _ 5.2 _ _ 99 _ _ 7.1 km NE of Bárðarbunga
5.2 seems reasonable. Impatiently I suggested 5.5 before the surface waves peaked on my seismometer.
I had just noticed a couple minutes before this EQ that the blue line on the Bard caldera GPS had fallen sharply, and wondered whether a quake would be along soon. Of course, the thin blue line may straighten itself out in due course.
here is another good site to check eq on, can zoom in really close. Would agree, different spot than usgs.
http://www.oe-files.de/gmaps/eqmashup.html
Yes, both EMSC and EO have it NNW of Bard. But nowhere near the rim. I am pretty sure that it’s not true, that all 5+ have been in the rim so far. This map from weerstation purports to show all 4+ in the past 7 days, and the red dots ar 5+ but I will be looking for another map to check this one!

I just made the new article hot. In my opinion, a very fine bit of word-smithing on Cbus’ part. Give it a read!
https://href.li/?https://volcanocafe.wordpress.com/2014/09/23/the-strangest-volcanoes-in-the-world-a-non-official-list/
Pingback: When Is a Caldera a Caldera? | VolcanoCafé